🌍 Public
pie chart d3
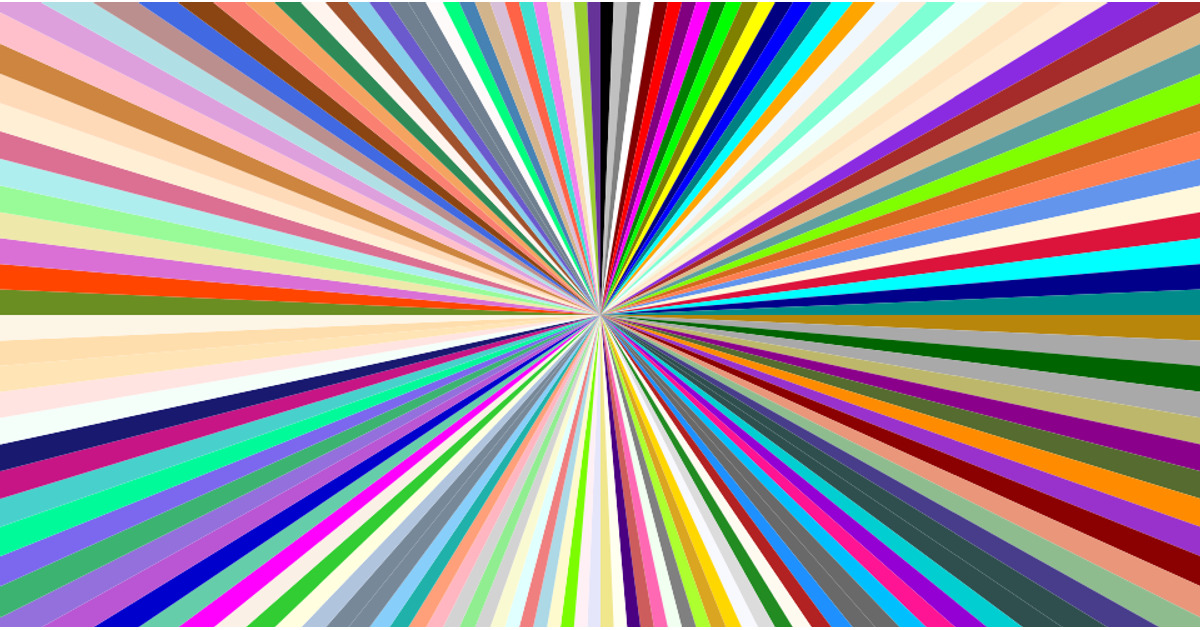
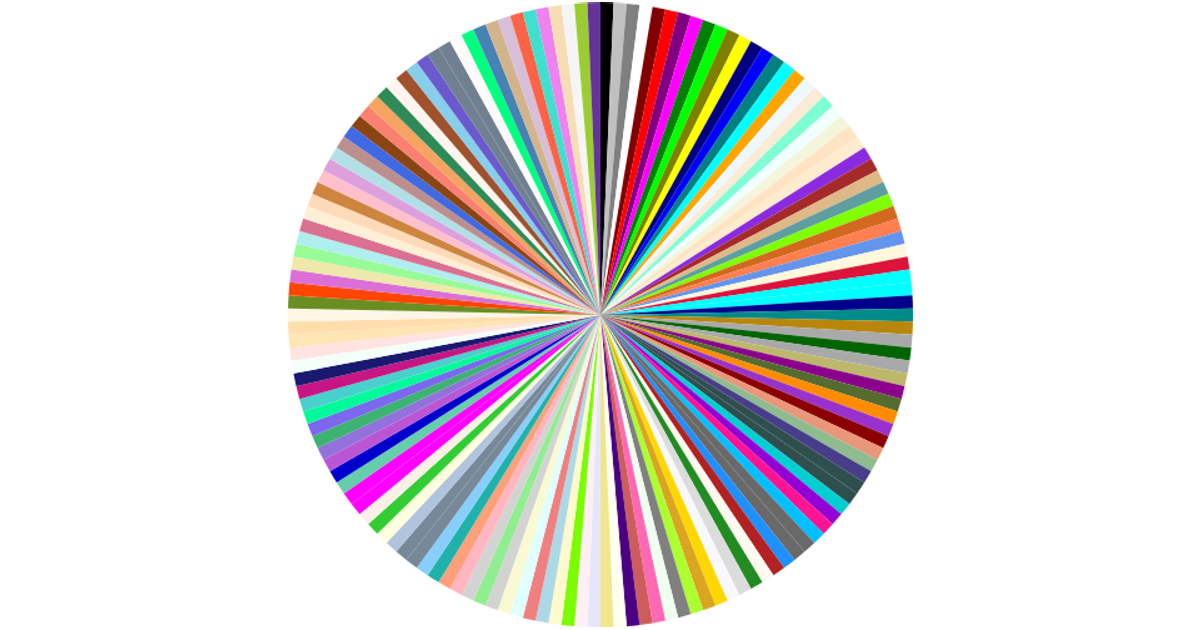
This example presents a radial burst visualization of CSS named colors, with each color represented as a wedge in a full circle. The data is loaded from a CSV file containing color names and their hexadecimal RGB values using d3.csv, and the layout is computed with d3.pie and d3.arc. React components render the resulting paths as SVG elements, filling each wedge with its corresponding hex color. The visualization is generated with React 16 and D3 v5, displaying the entire color palette in a single circular arrangement.
AI-generated descriptionA program that loads in some data about CSS named colors using D3 utilities, and uses React to render the data as a radial burst!
MIT Licensed






Comments
Sign in to join the discussion.