🌍 Public
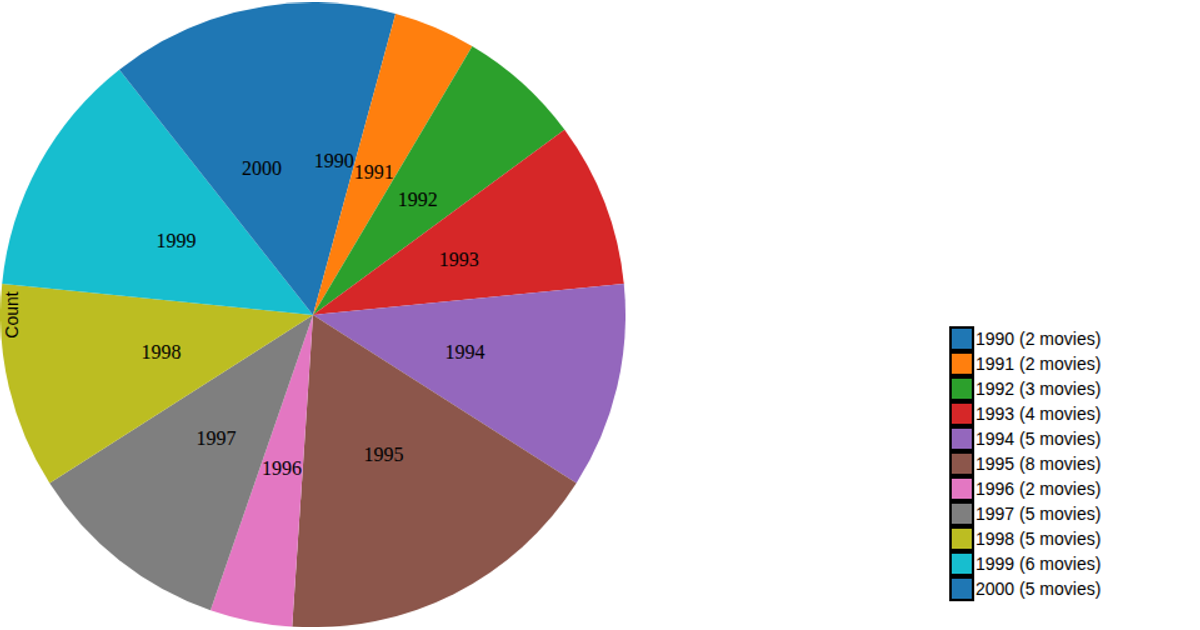
Pie Chart to show Runtime of top rated movies on IMDB
This visualization presents the runtime of the top ten rated movies on IMDB as a pie chart, with each slice colored by runtime and accompanied by a legend listing the movie title and its duration in minutes. The chart is rendered as SVG using D3 v5, with the `pie`, `arc`, and `scaleOrdinal` functions from D3 computing the slice geometry and categorical color scheme. Data is loaded from a CSV file hosted on GitHub, and hover events log the runtime to the console.
AI-generated descriptionA bare minimum HTML page demonstrating use of CSS and JavaScript.
See also React Starter.
MIT Licensed





Comments
Sign in to join the discussion.