🌍 Public
Assignment 2
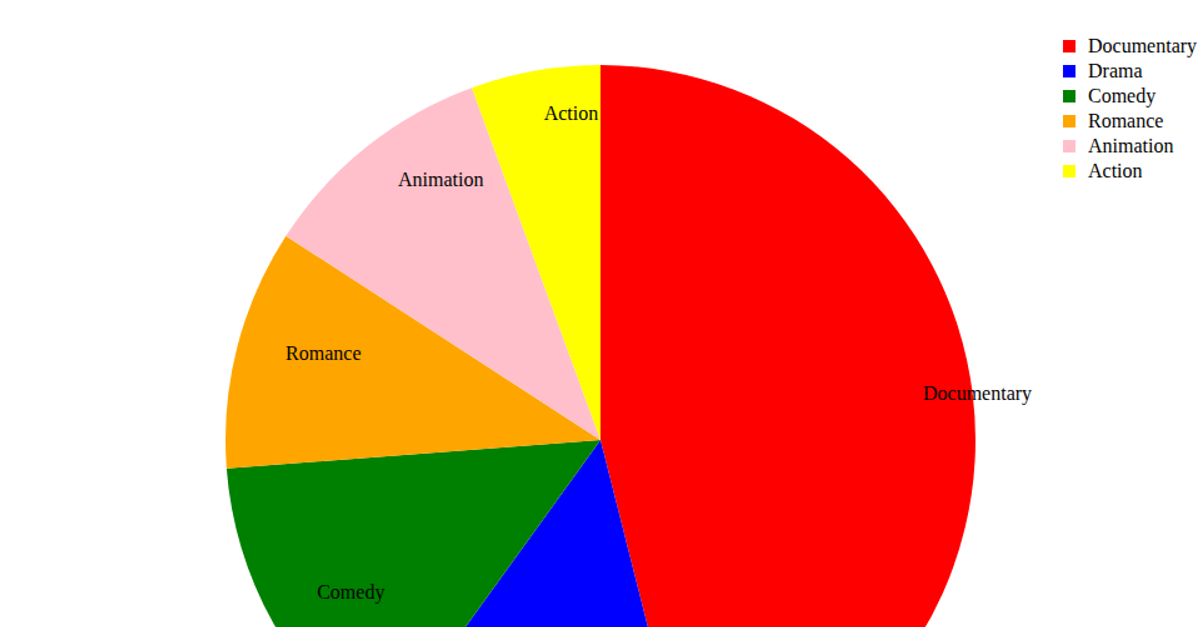
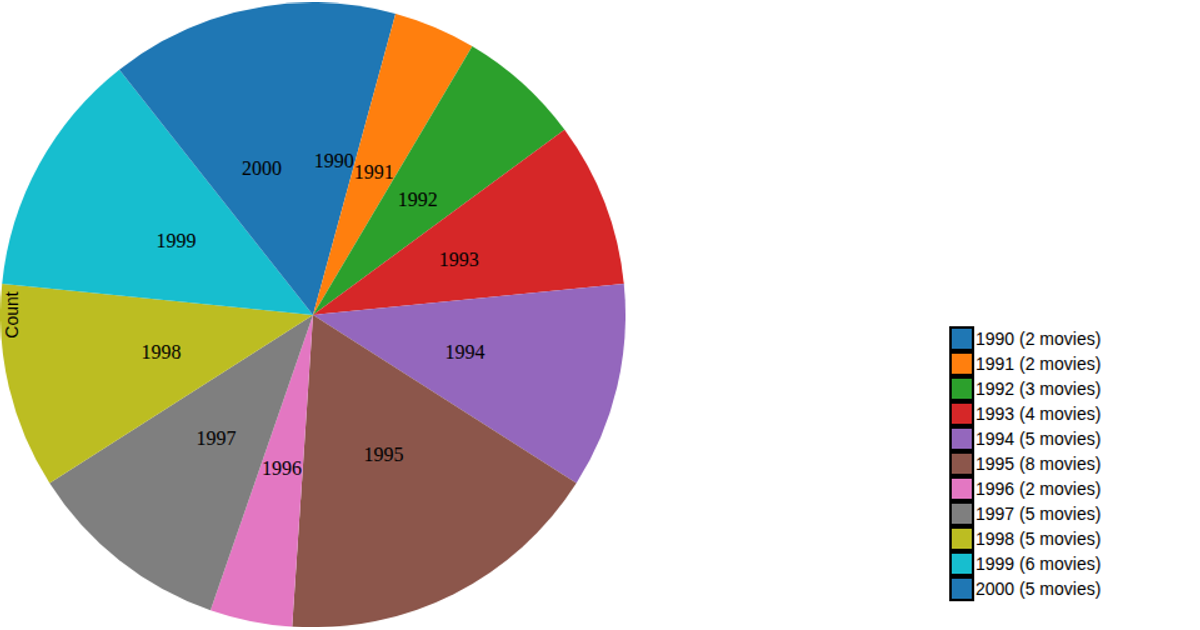
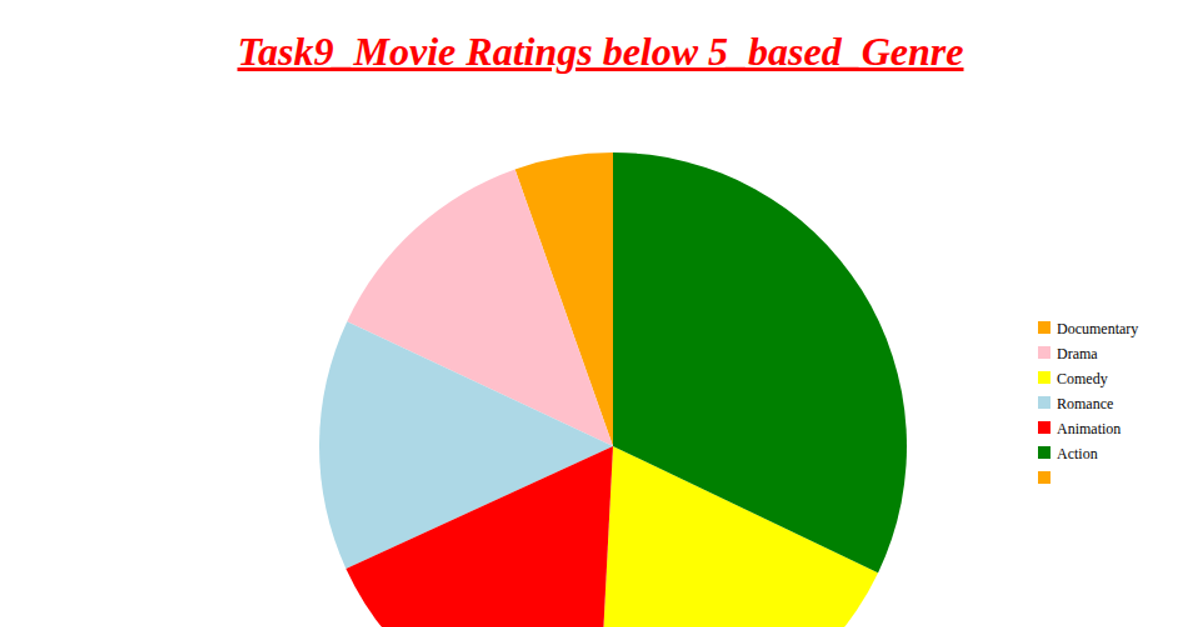
This visualization presents a pie chart of the top 10 movies and their IMDb ratings, sourced from a CSV file. The chart uses distinct colors for each segment and includes a legend that pairs movie titles with their ratings. Built with D3 v5, the code uses `d3.csv`, `d3.pie`, `d3.arc`, and `d3.scaleOrdinal` to generate the SVG, with labels and a legend constructed from SVG `path` and `text` elements.
AI-generated descriptionThis is a Pie chart
MIT Licensed




Comments
Sign in to join the discussion.