🌍 Public
act6 question4
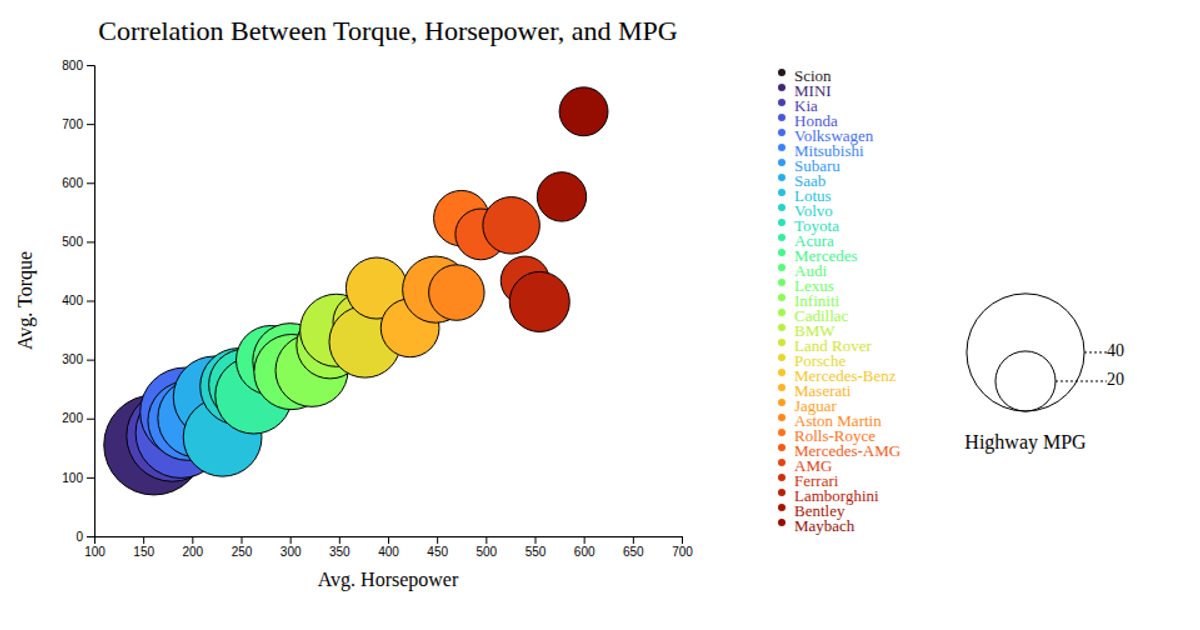
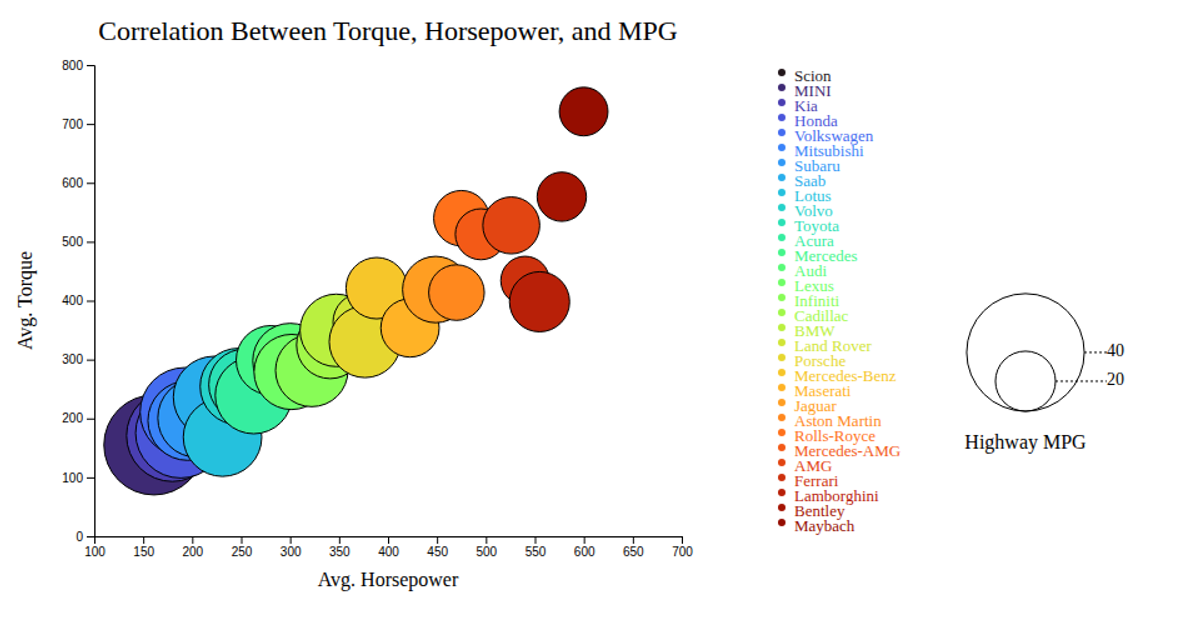
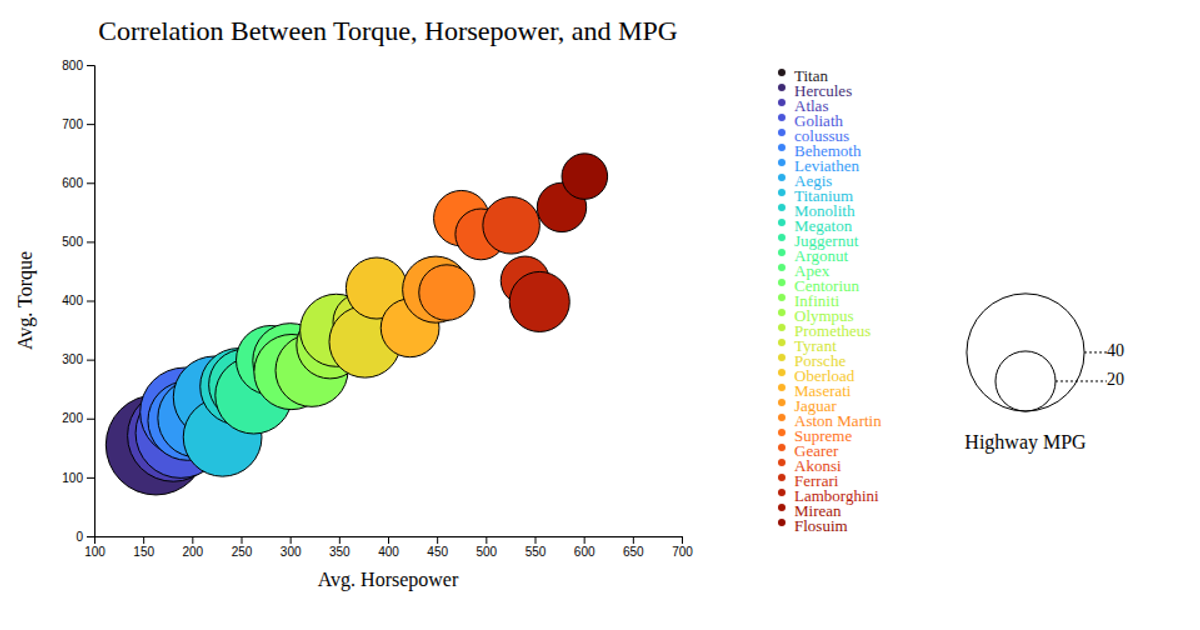
This bubble chart explores the correlation between a vehicle's torque, horsepower, and highway MPG. The chart uses `d3.scaleLinear` for the x and y axes and for bubble radius, with a `d3.scaleOrdinal` for color-coding by car make. Interactive tooltips appear on mouseover, implemented with D3's selection and event handling. A legend for the bubble size scale is also included. The visualization is rendered as an SVG and uses D3's `d3.csv` to load data from a local file.
AI-generated descriptionAn example showing the capabilities of VizHub:
- Loads D3 via UNPKG.
- Demonstrates use of
importfrom"d3". - Demonstrates use of
importfrom local ES6 modules.
MIT Licensed




Comments
Sign in to join the discussion.