🌍 Public
act6_task4_q9
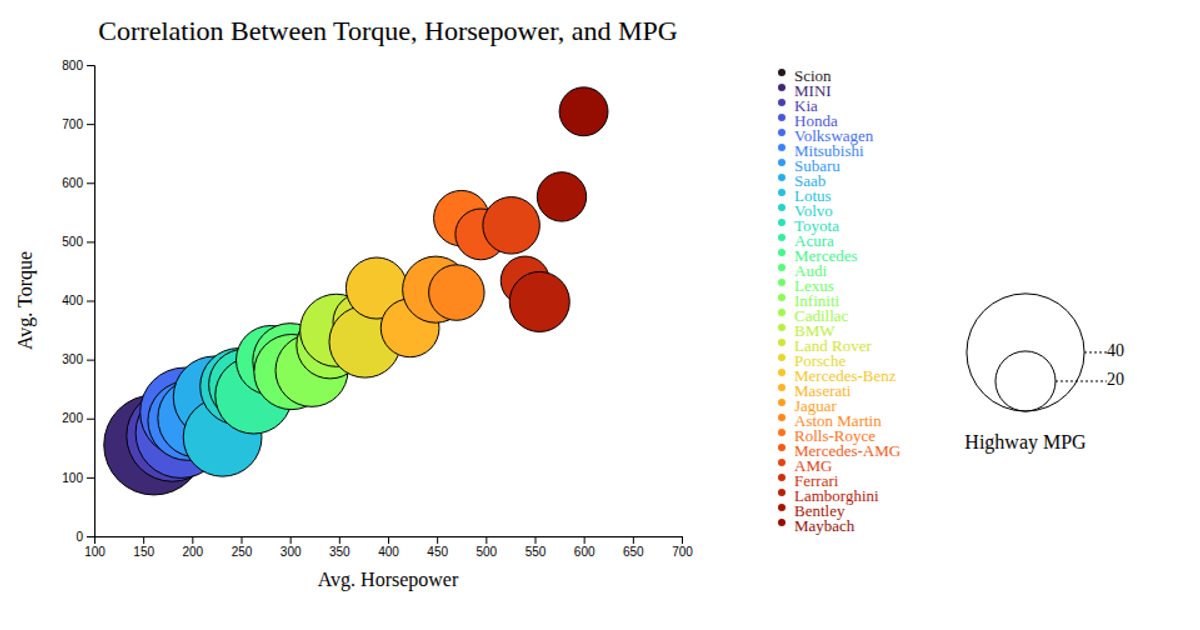
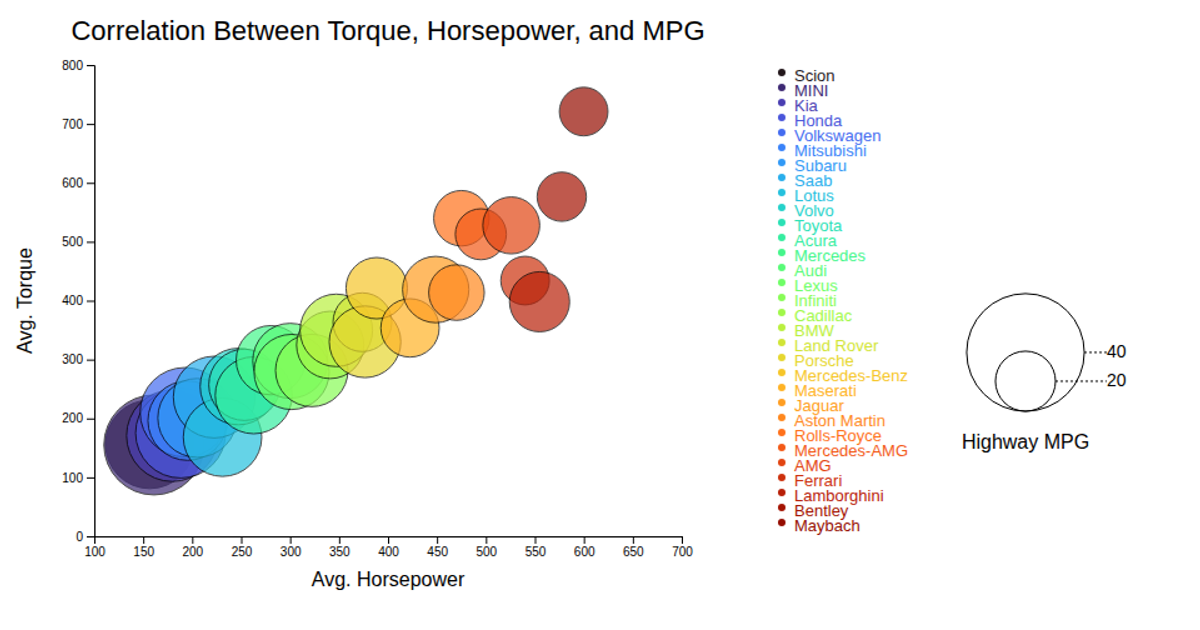
This bubble chart visualizes the correlation between average horsepower, torque, and highway MPG across 27 car makes. Each bubble's position encodes horsepower (x-axis) and torque (y-axis), while its radius represents highway MPG and its color distinguishes the car manufacturer. The visualization uses D3.js v7 with `d3.scaleLinear` for axes, `d3.scaleSqrt` for bubble sizing, and `d3.scaleOrdinal` with `d3.schemeCategory10` for color encoding. Interactive tooltips display the exact values on hover, and the chart includes both color and size legends. Data comes from the local `bubblechart.csv` file.
AI-generated descriptionMIT Licensed


Comments
Sign in to join the discussion.