🌍 Public
Proportional Symbols Map in D3
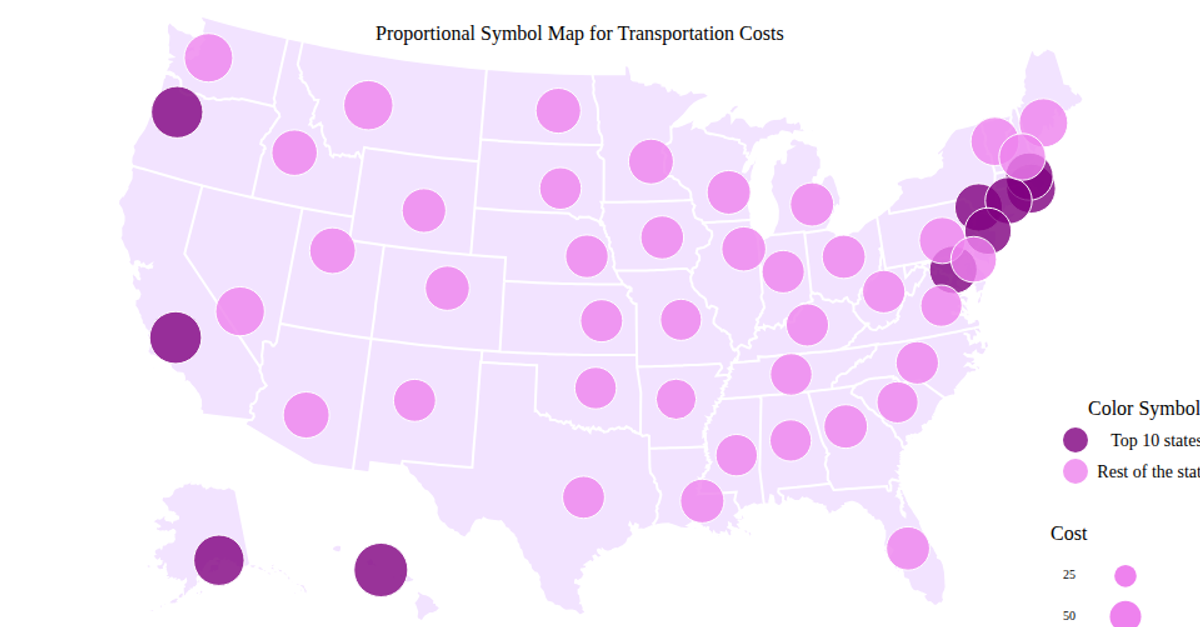
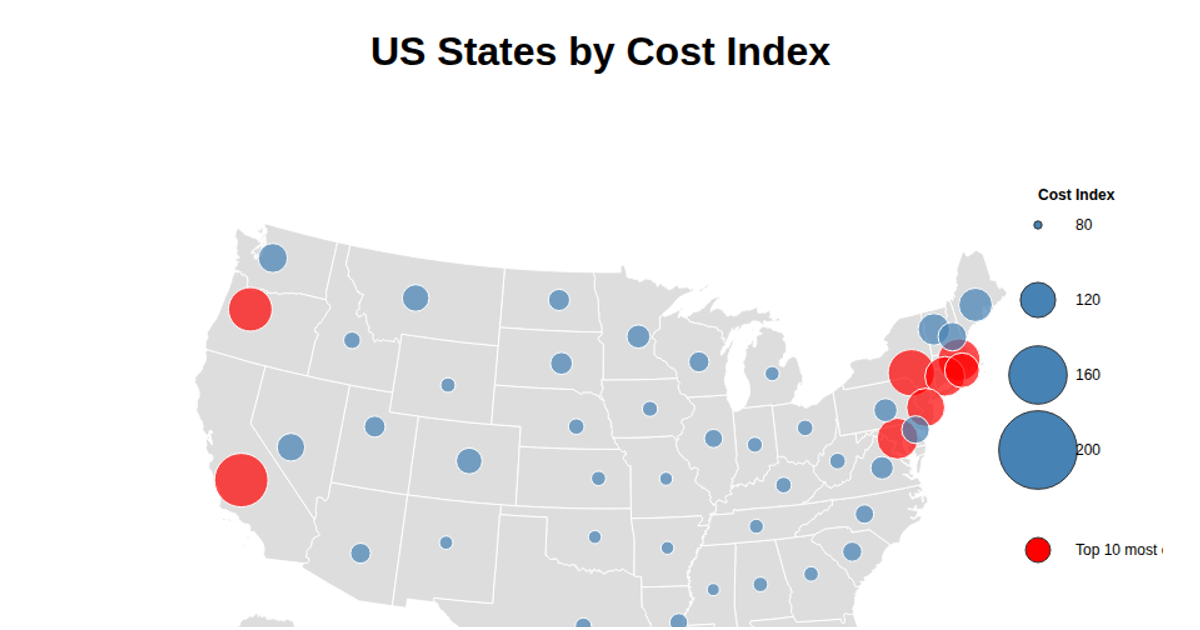
A proportional symbols map visualizes transportation cost indices across U.S. states using D3.js and the topojson library. Each state is rendered as a gray polygon with a circular symbol whose size corresponds to its cost value. The visualization employs an Albers equal-area projection via `d3.geoAlbersUsa` and `d3.geoPath`, with state centroids hardcoded to position the proportional circles. Interactive tooltips appear on hover, while symbols animate on load. The map is drawn in SVG with data fetched from a CSV hosted on GitHub.
AI-generated descriptionMIT Licensed




Comments
Sign in to join the discussion.