🌍 Public
Tut-3(Swethu)
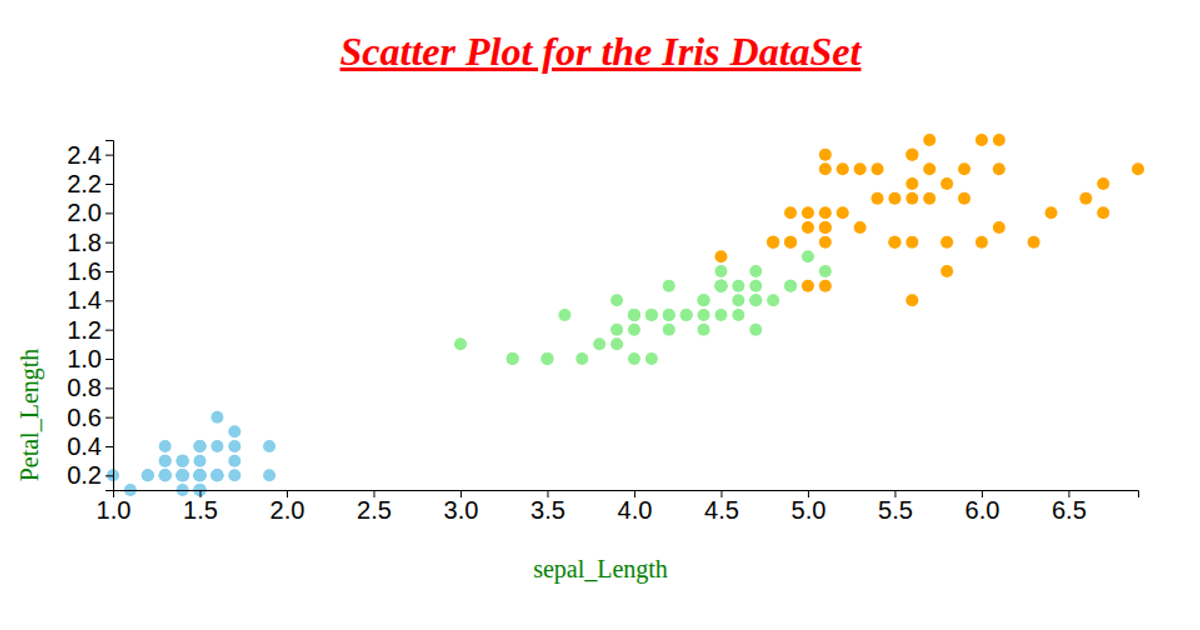
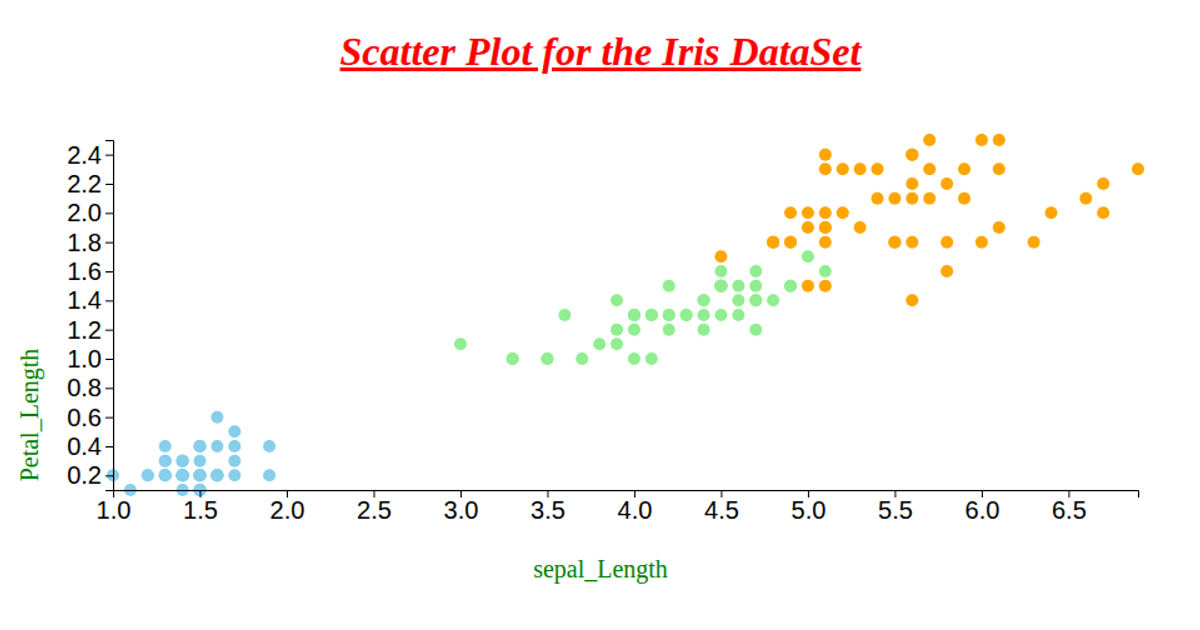
This scatter plot displays the Iris dataset with petal dimensions on the axes, coloring each point by species (skyblue for setosa, lightgreen for versicolor, orange for virginica). The SVG visualization uses d3.csv to load remote data, d3.scaleLinear and d3.extent for scaling, and d3.axisLeft/axisBottom for axes. Points are rendered as circles via d3.selectAll join, with petal length and width mapped to x/y positions while sepal lengths are stored as radius properties on each datum.
AI-generated descriptionWe are Displaying the IRIS dataset using Scatter plot.
MIT Licensed





Comments
Sign in to join the discussion.