🌍 Public
Exploring own RDW data - Basic chart
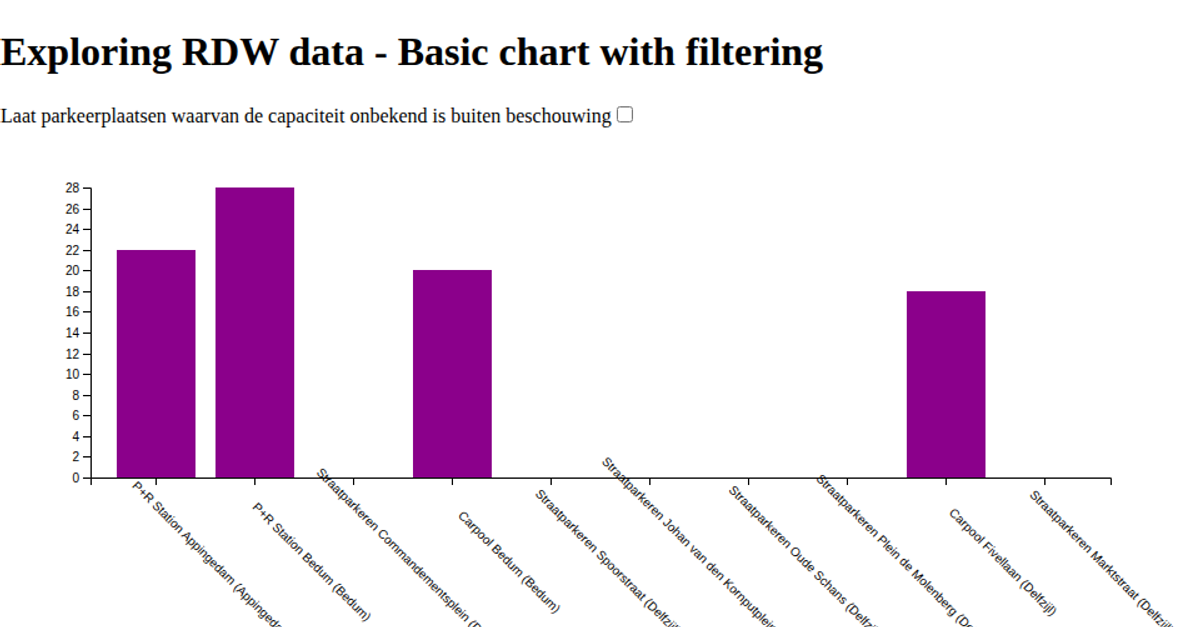
This example visualizes the start dates of Dutch parking regulations from a local dataSelection.json file. The bar chart uses an SVG rendering with D3 v6, where each bar represents a usage type like "Garageparkeren" or "Betaald Parkeren". The code uses `d3.scaleBand` and `d3.scaleLinear` for the axes, with `d3.axisBottom` and `d3.axisLeft` for ticks. The visualization demonstrates basic data exploration, showing how D3's `d3.json` loads local data and `d3.select` targets the SVG element for drawing.
AI-generated descriptionExample of how to work with the RDW data
MIT Licensed



Comments
Sign in to join the discussion.