🌍 Public
Exploring RDW data - Basic chart
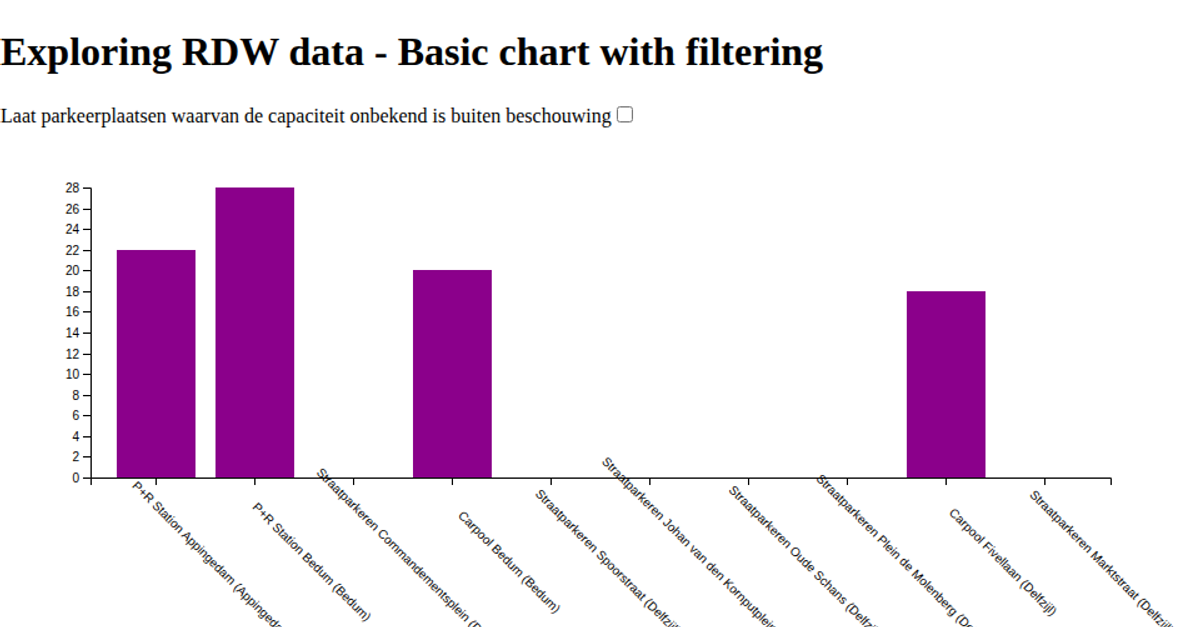
This visualization uses D3 v6 to explore a selection of RDW parking data from the Dutch national parking registry. It displays a horizontal bar chart showing the capacity of various Park & Ride, carpool, and paid street parking locations, with bars colored Darkmagenta via `d3.scaleBand` for the x-axis and `d3.scaleLinear` for the y-axis. The example loads data either from a local JSON file or a remote API proxy, and renders the chart as SVG using D3 selections and margin conventions.
AI-generated descriptionExample of how to work with the RDW data
MIT Licensed



Comments
Sign in to join the discussion.