🌍 Public
Activity 6 task 2
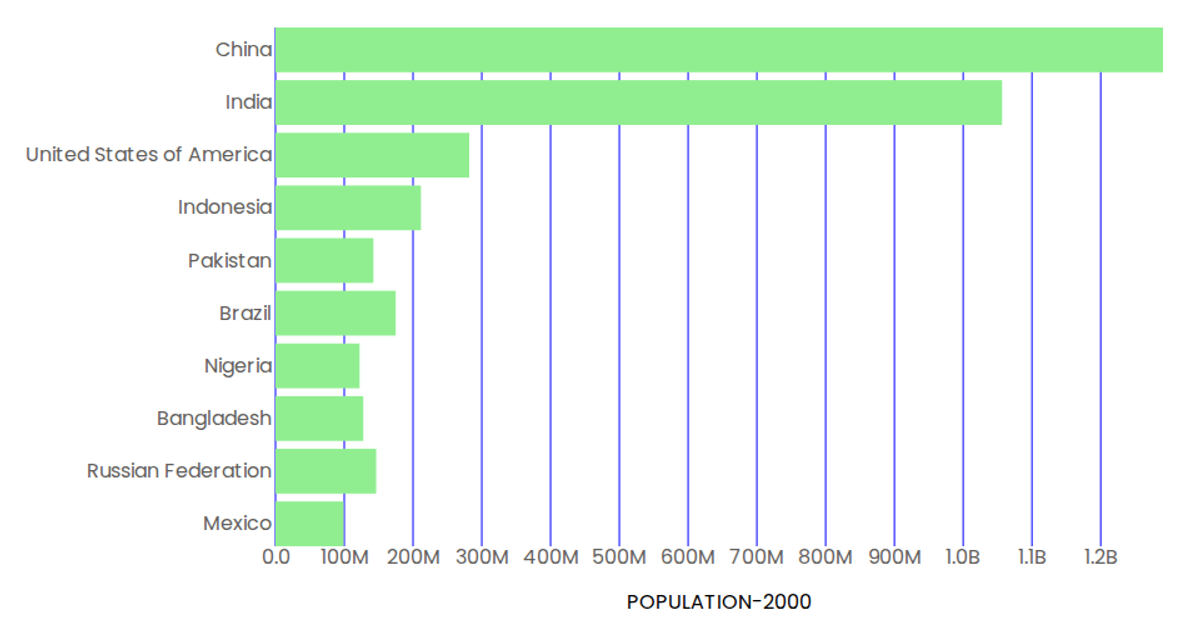
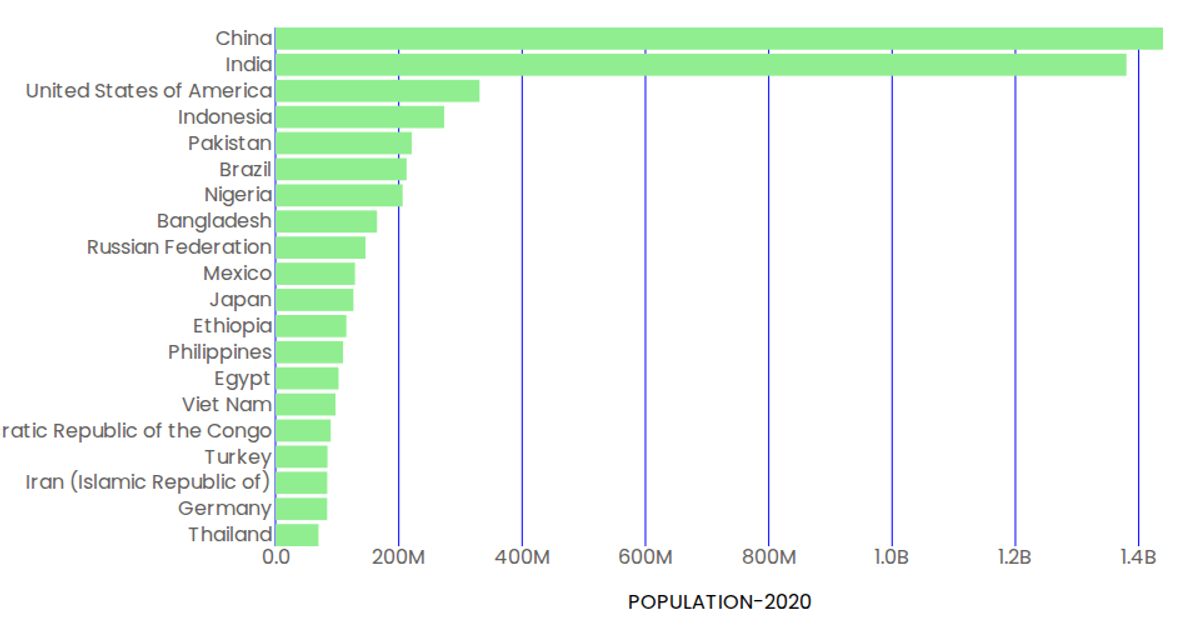
This example displays a horizontal stacked bar chart comparing the distribution of student grades across six countries, with each bar partitioned into five grade-range segments. It loads D3 v5 from UNPKG and uses the `select` import to update the DOM. The data is sourced from a local CSV file containing grade proportions, though the visible chart rendering logic is not implemented in the provided code, which only sets a text message.
AI-generated descriptionAn example showing the capabilities of VizHub:
- Loads D3 via UNPKG.
- Demonstrates use of
importfrom"d3". - Demonstrates use of
importfrom local ES6 modules.
MIT Licensed






Comments
Sign in to join the discussion.