🌍 Public
Race Bar chart
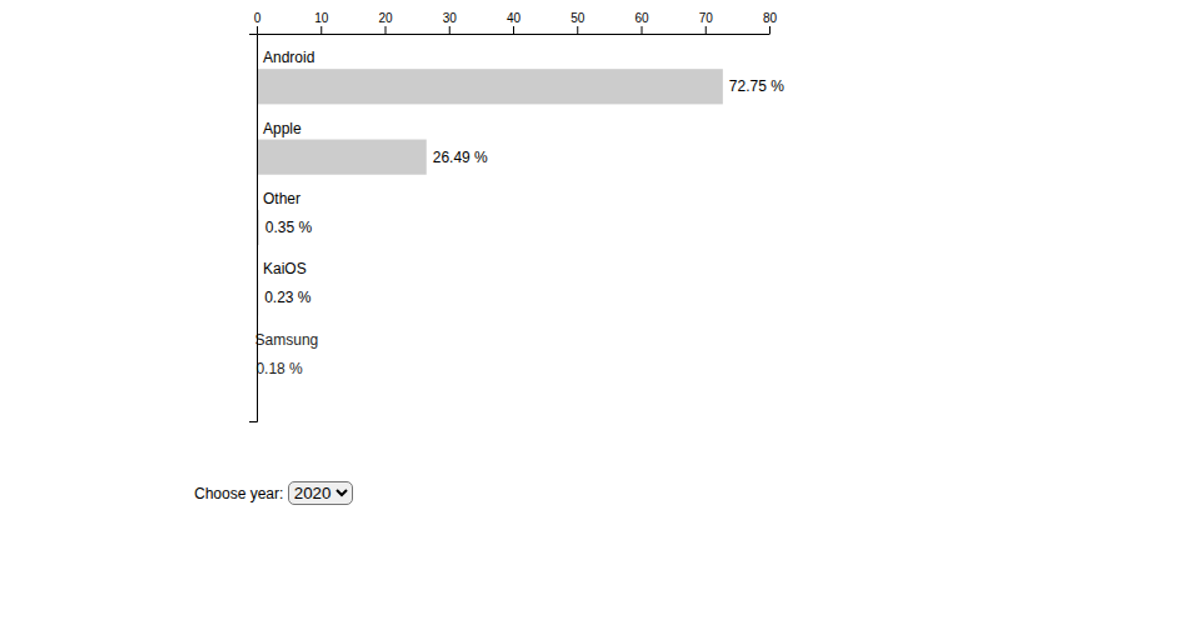
This animated bar chart race displays the evolution of mobile app usage by network from 2003 to 2018, with bars reordering dynamically as values change. Built with amCharts v4, it uses the animated theme to smoothly interpolate bar positions and value-axis scaling over 4-second intervals. The chart auto-plays via an am4core PlayButton, and a color adapter assigns each bar a distinct color from the chart’s palette. Data is updated yearly, with non-zero categories zoomed into view, and numbers are formatted with K/M/B prefixes.
AI-generated descriptionThis is the race bar chart for technology. Click on the play button inside the chart to see the magic.
MIT Licensed




Comments
Sign in to join the discussion.