🌍 Public
Bar Chart Race
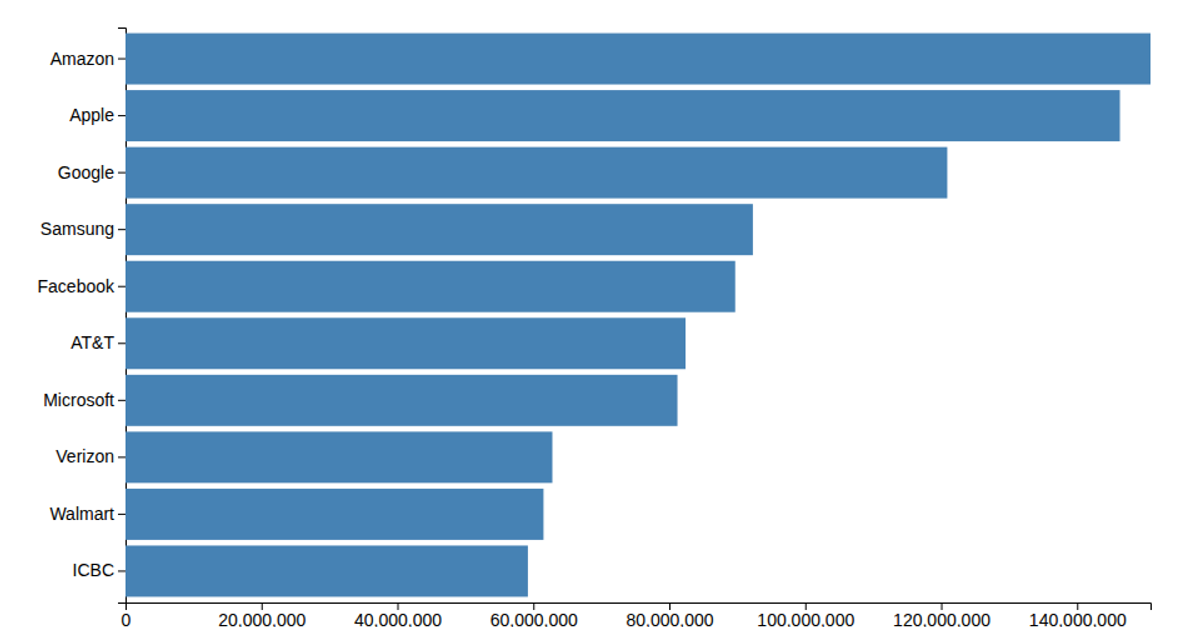
This bar chart race animates the changing rankings of the world's most valuable brands from 2000 onward, using data from Interbrand. The visualization presents a dynamic competition where bars representing top brands, such as Coca-Cola and Microsoft, shift positions over time. Built with React and D3 v6, it uses SVG and animation to smoothly interpolate the values and ranks between yearly data points, creating a fluid, time-lapse effect. The code relies on D3's `scaleLinear`, `scaleBand`, `transition`, and `easeLinear` to orchestrate the movement, while a custom linear interpolation between keyframes and sorting logic drive the visual ranking updates.
AI-generated descriptionA bare minimum HTML page.
See also React Starter.
MIT Licensed





Comments
Sign in to join the discussion.