🌍 Public
Amulya kannam
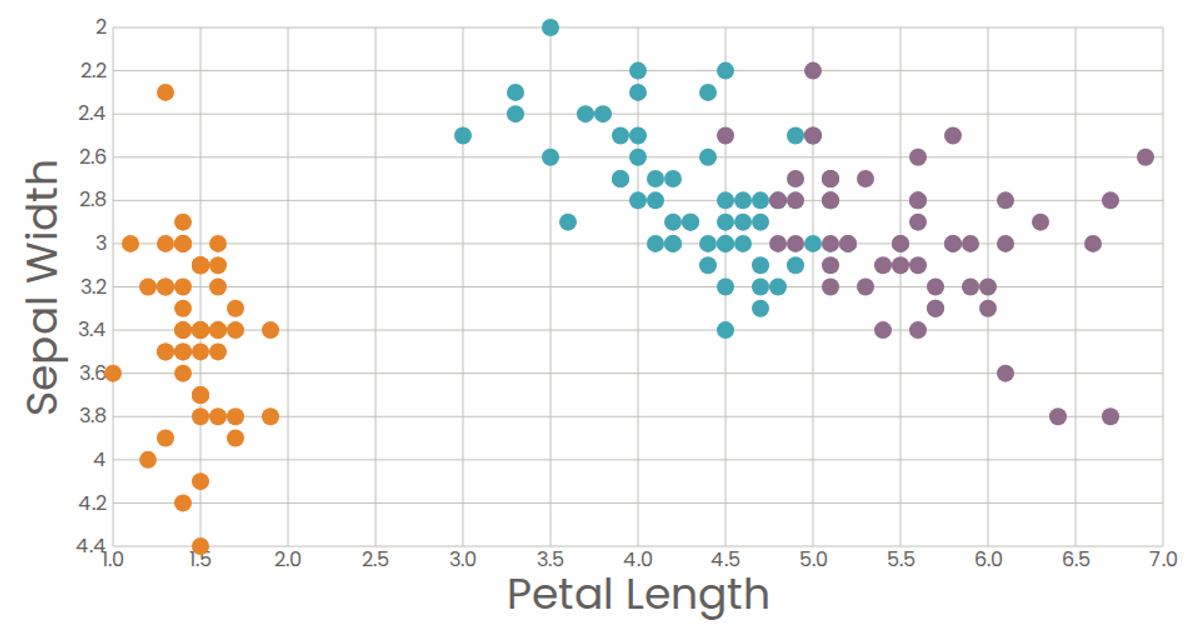
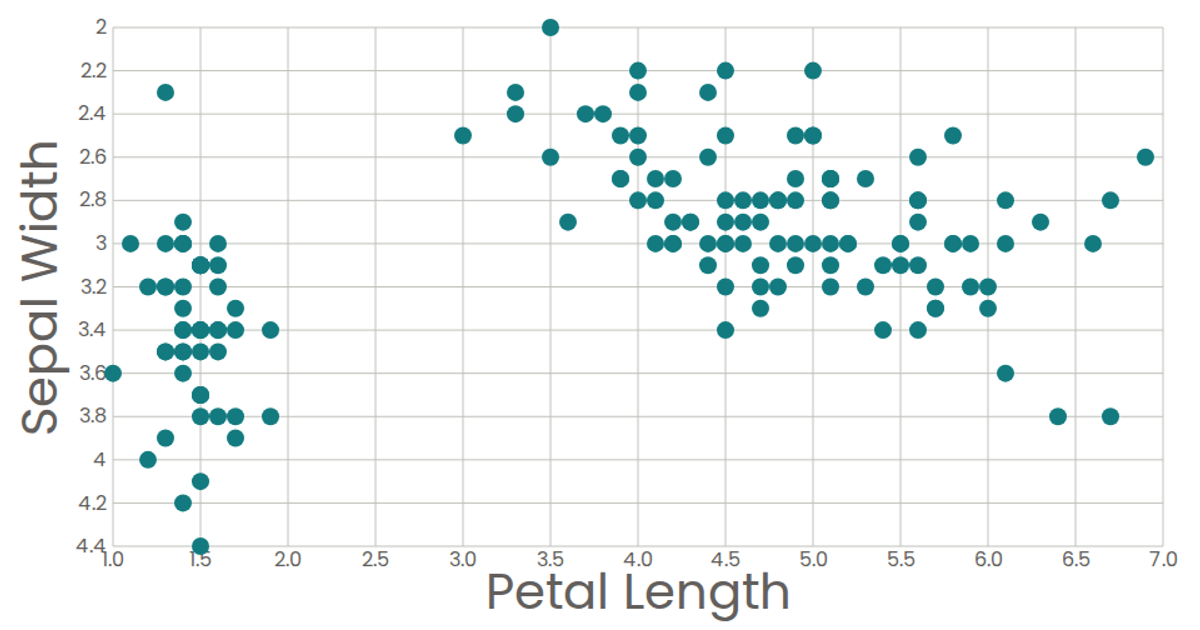
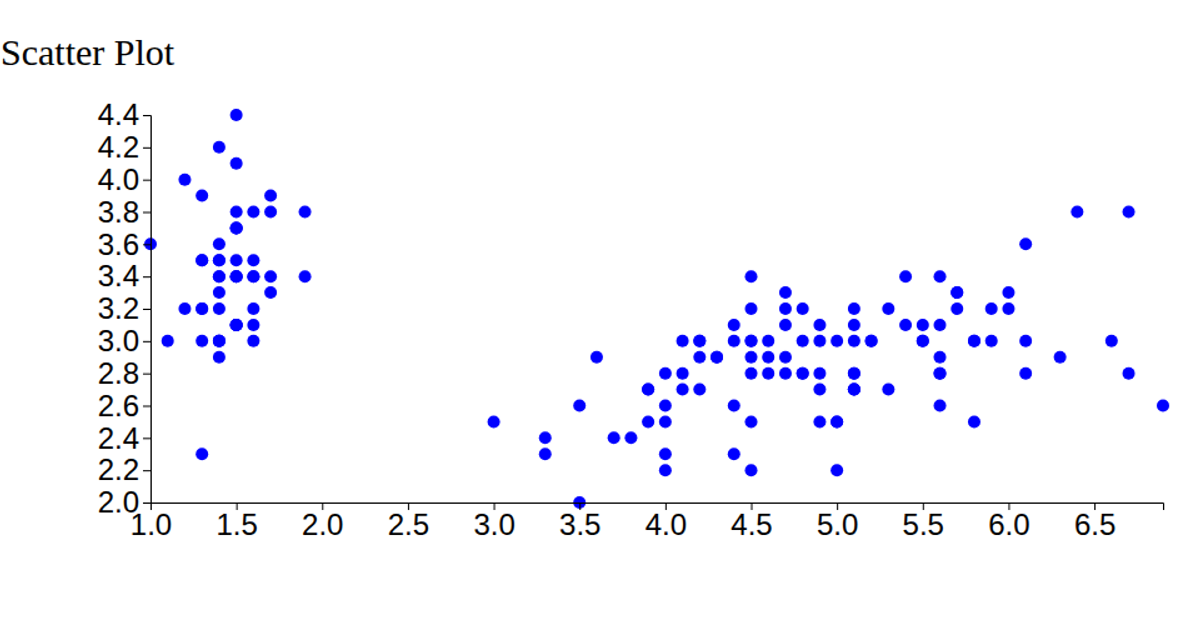
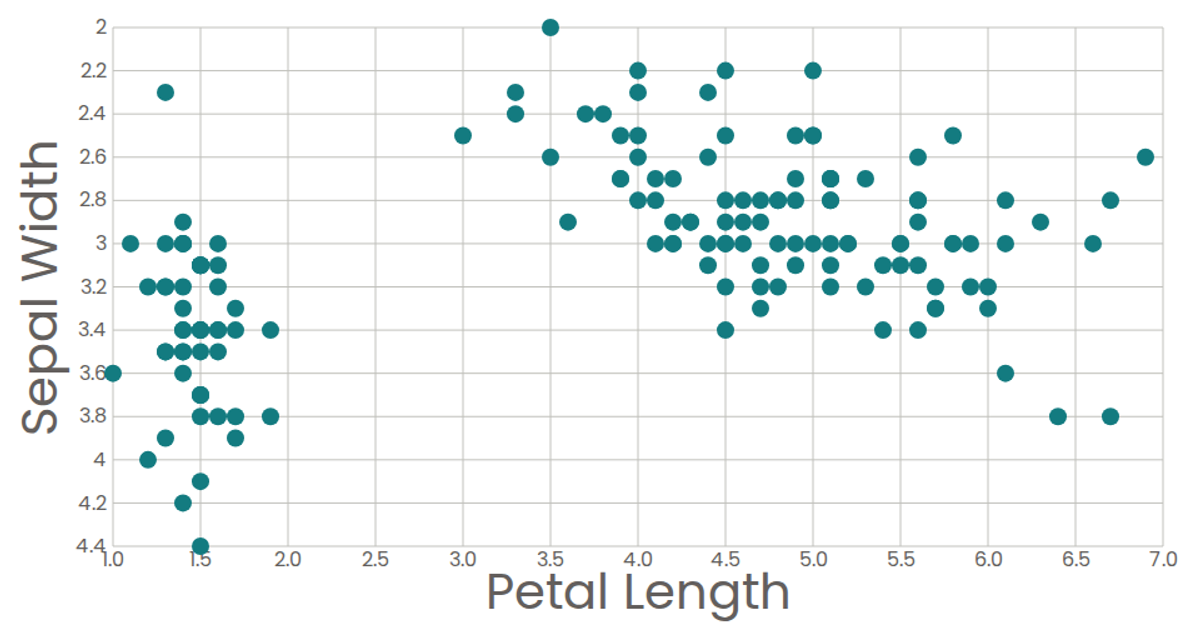
A scatter plot of the Iris dataset visualizes petal length against sepal width. The D3 scaleLinear and scaleOrdinal APIs map data to positions and colors, with each species assigned a distinct hue via the color scale. The React application uses SVG circles, rendered with a map over the data, to display each sample. Interactive tooltips show the petal length value on hover.
AI-generated descriptionA scatter plot of The Iris Dataset.
MIT Licensed




Comments
Sign in to join the discussion.