🌍 Public
Scatter Plot
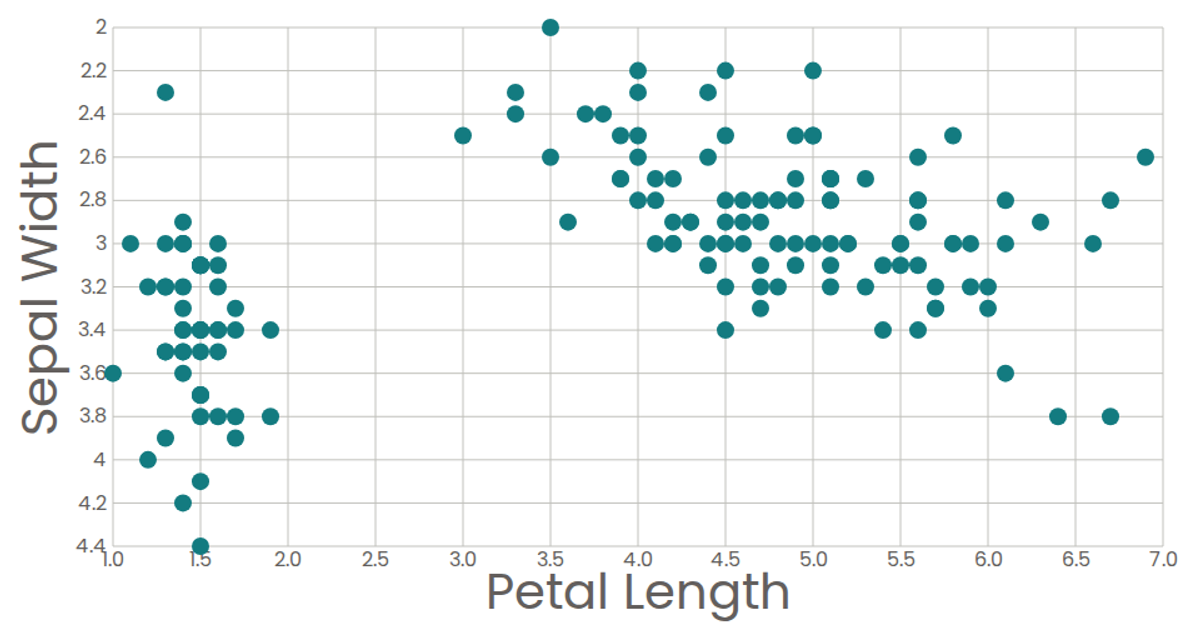
This interactive scatter plot visualizes the Iris flower dataset, mapping petal length and sepal width for individual samples. Circles are colored by species, with a legend-free color scheme distinguishing Adelie (grey), Gentoo (green), and other species (blue). The visualization uses D3 v5 with a React-friendly SVG rendering approach, employing `d3.csv` for data loading, `d3.scaleLinear` for axes, and `d3.axisLeft`/`d3.axisBottom` for chart scaffolding. It includes a titled header and responsive sizing based on window dimensions.
AI-generated descriptionA bare minimum HTML page demonstrating use of CSS and JavaScript.
See also React Starter.
MIT Licensed



Comments
Sign in to join the discussion.