🌍 Public
Activity 6_Task 3
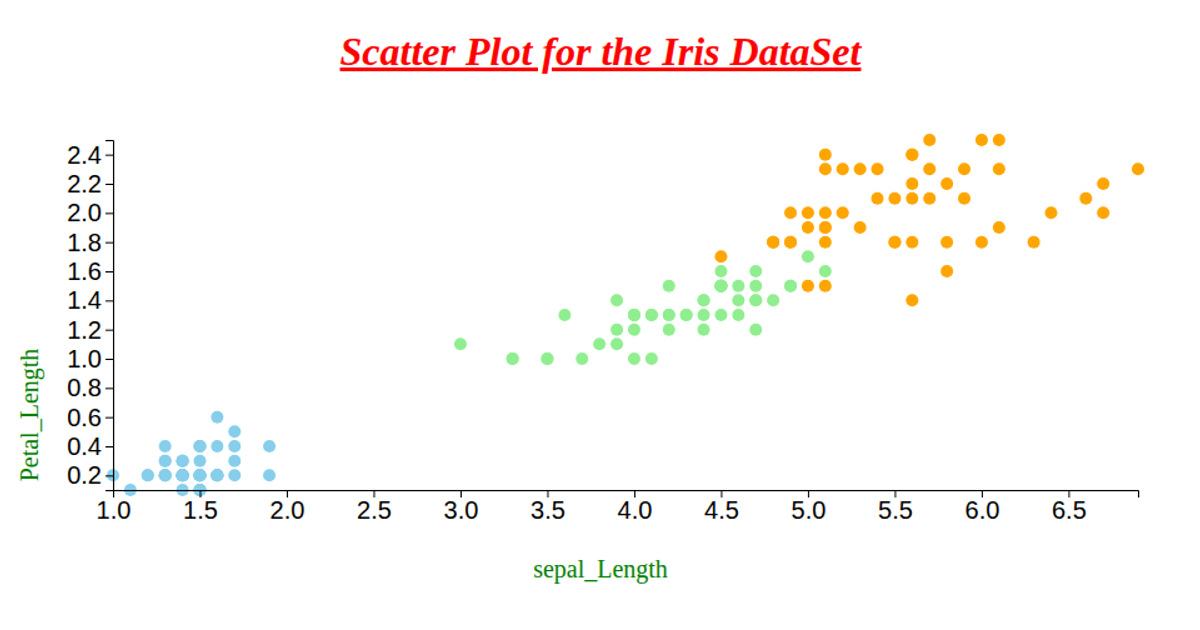
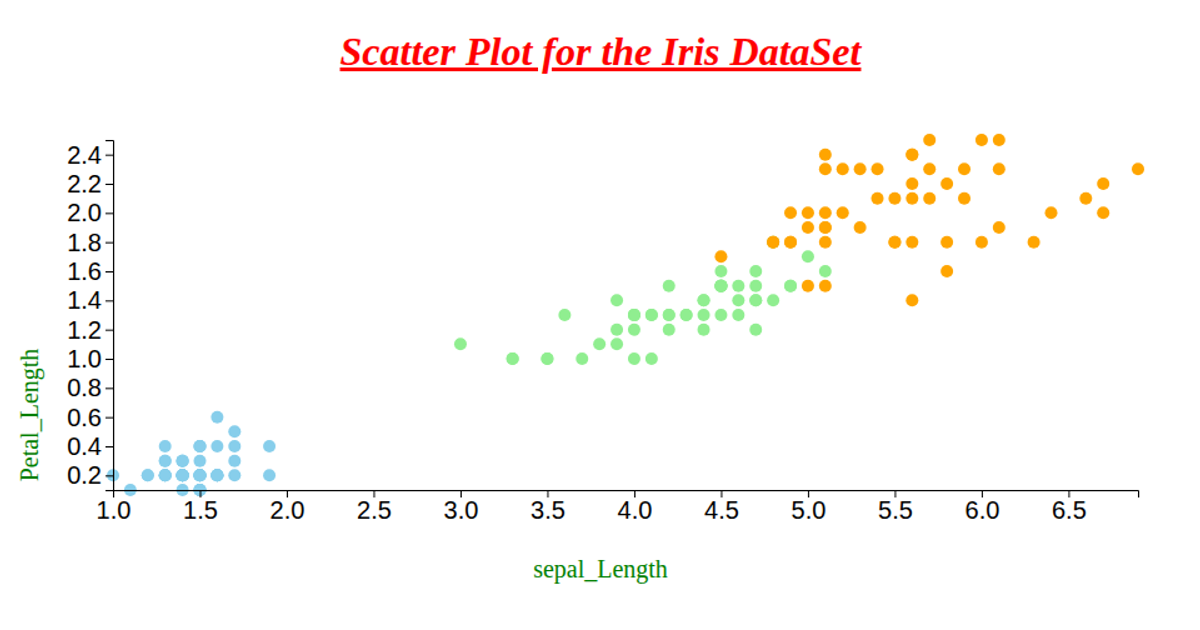
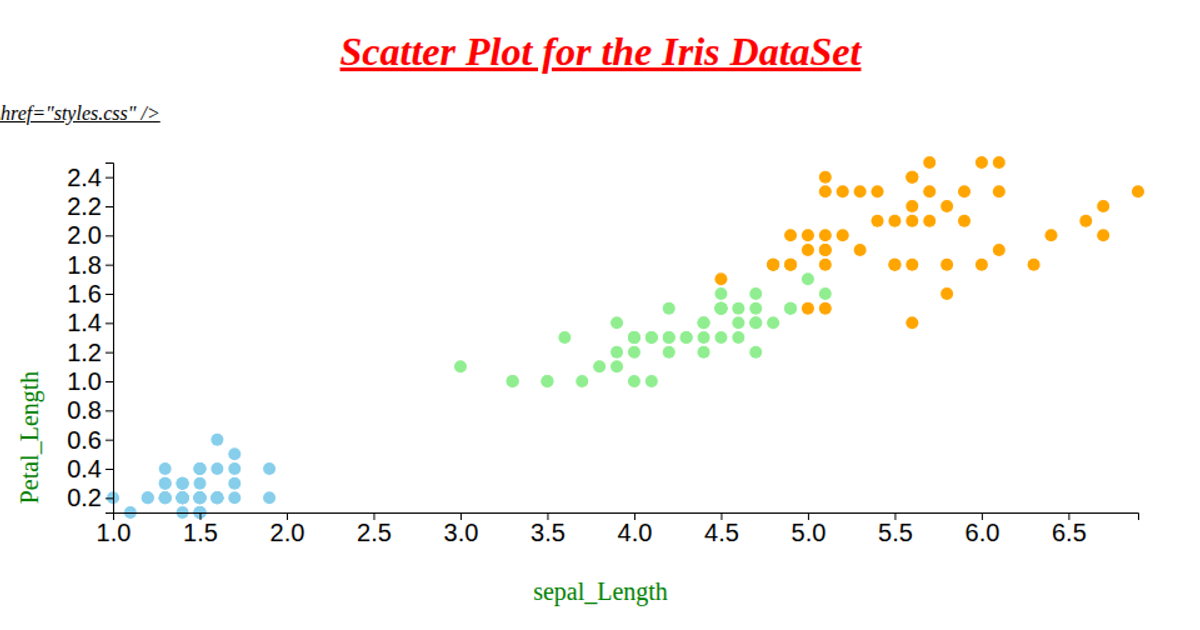
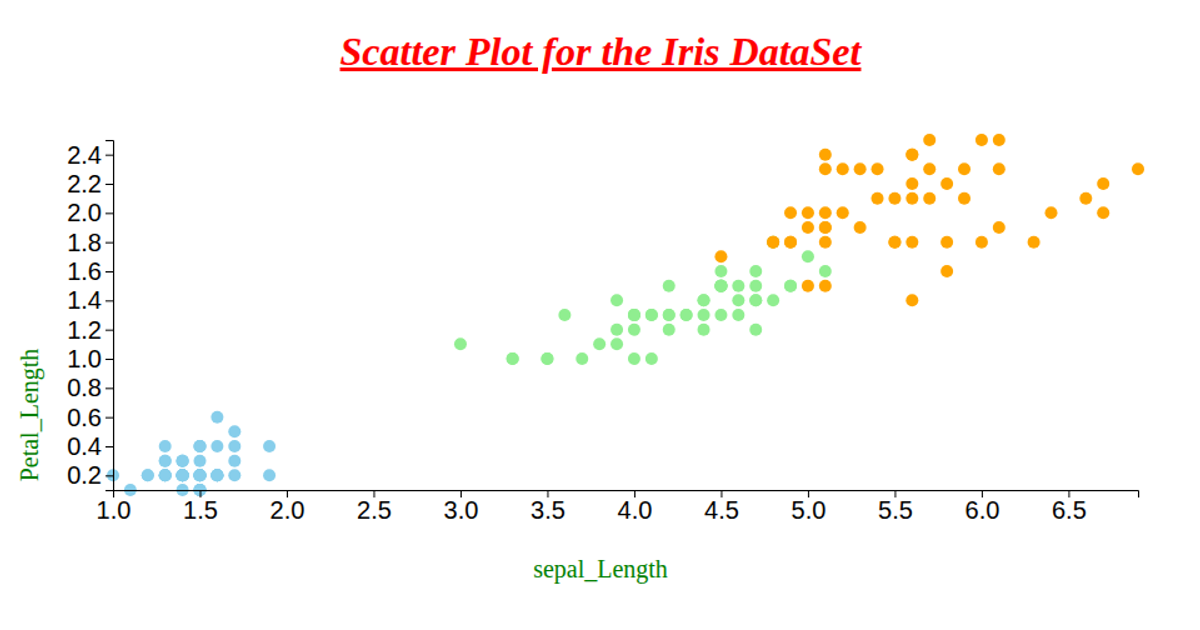
This scatter plot visualizes the IRIS dataset, showing the relationship between petal length and petal width, with data points colored by species (skyblue for setosa, lightgreen for versicolor, orange for virginica). It uses D3 version 6's `csv` loader to fetch data from a GitHub repository, and employs `scaleLinear`, `extent`, `axisLeft`, and `axisBottom` to construct the chart. The visualization renders circles as SVG elements, with marks projected via linear scales and margins calculated from the window dimensions.
AI-generated descriptionWe are Displaying the IRIS dataset using Scatter plot.
MIT Licensed




Comments
Sign in to join the discussion.