🌍 Public
Fork of map1
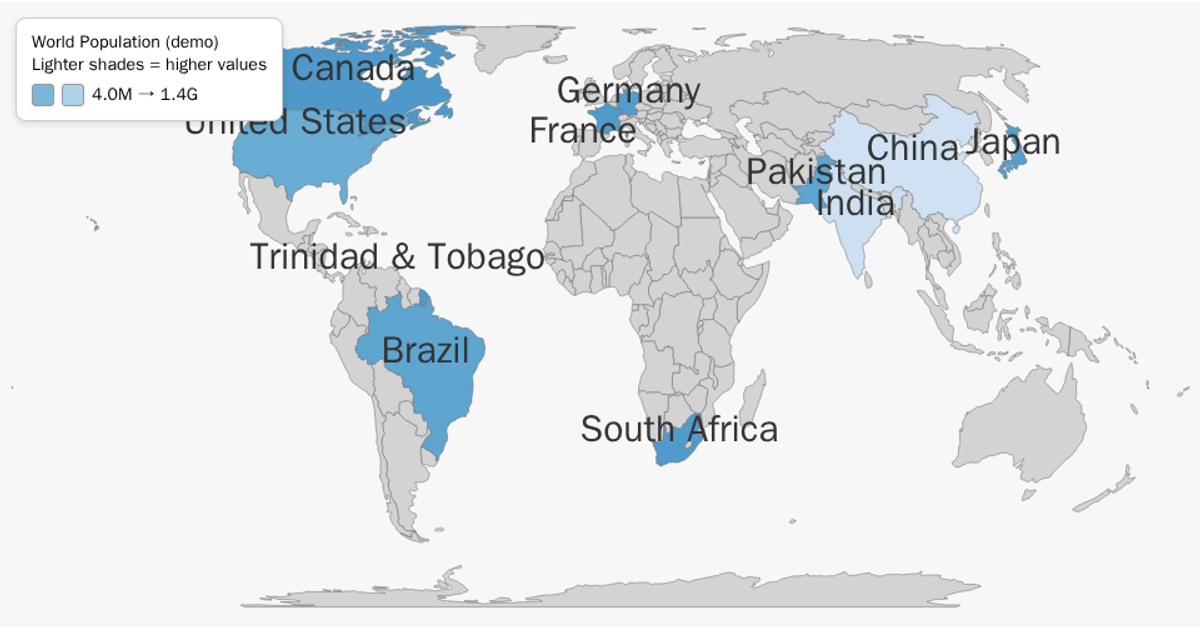
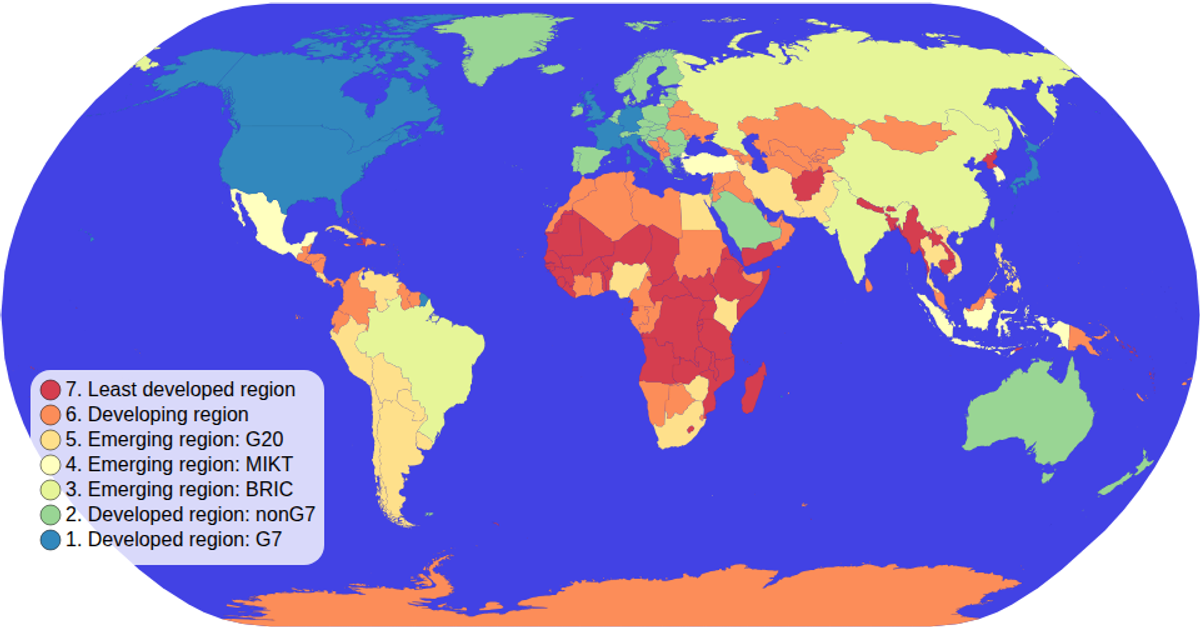
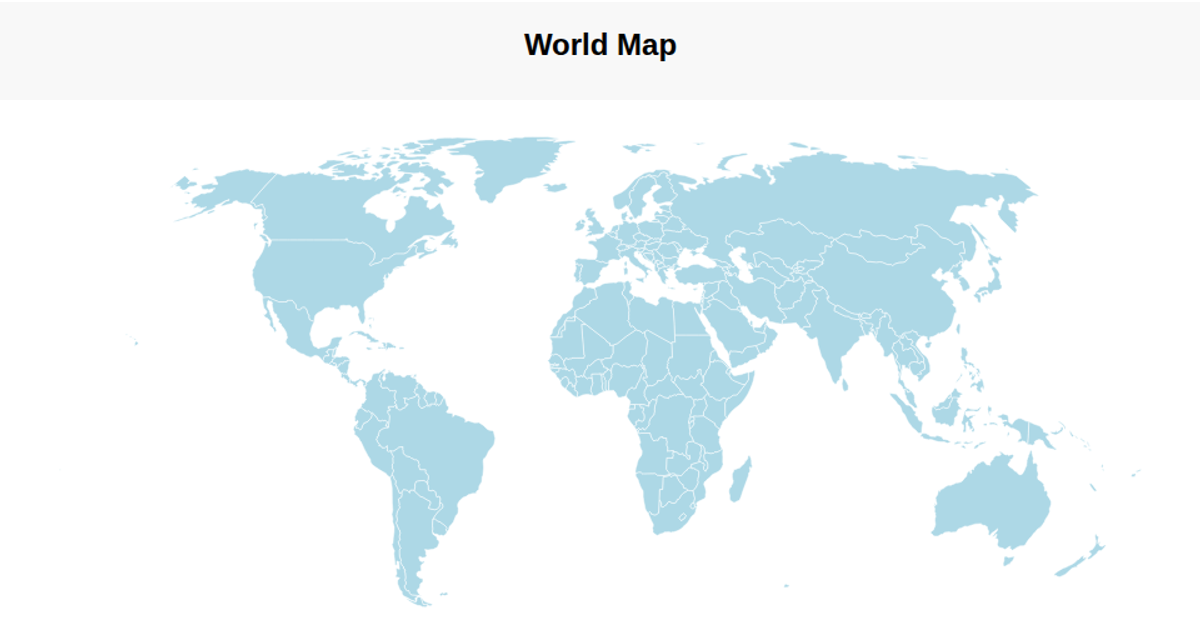
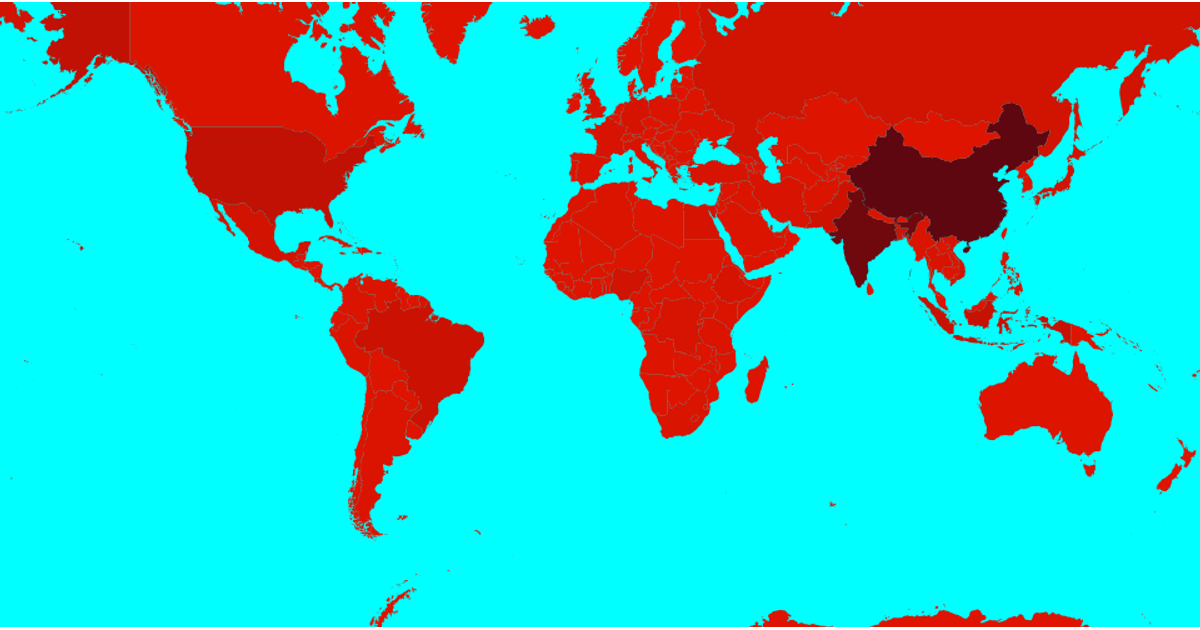
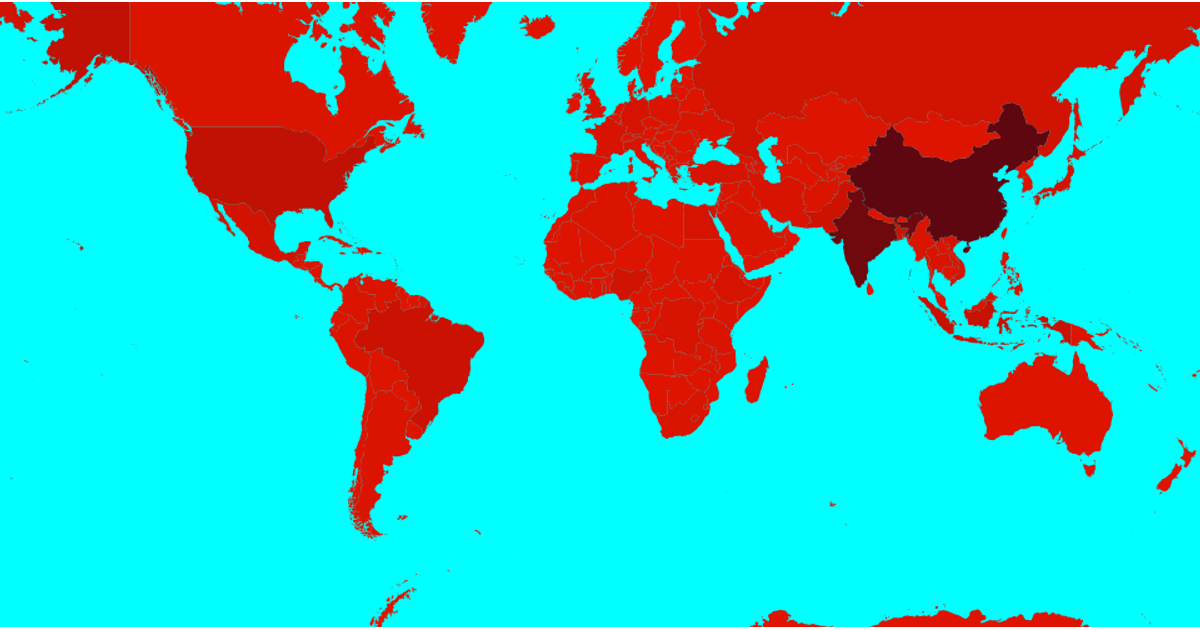
This world map uses a blue sequential color scale to show internet penetration percentages for a sample of countries, with darker blues indicating higher usage and gray for missing data. Built with d3.geoPath and a Natural Earth projection, the visualization renders country boundaries from the world-atlas TopoJSON and joins names from its TSV file. Interactive tooltips display country names and values, while a legend and captions clarify the color mapping. The code uses d3.scaleSequential with an interpolateBlues interpolator for the choropleth coloring.
AI-generated descriptionMIT Licensed



Comments
Sign in to join the discussion.