🌍 Public
Fork of map
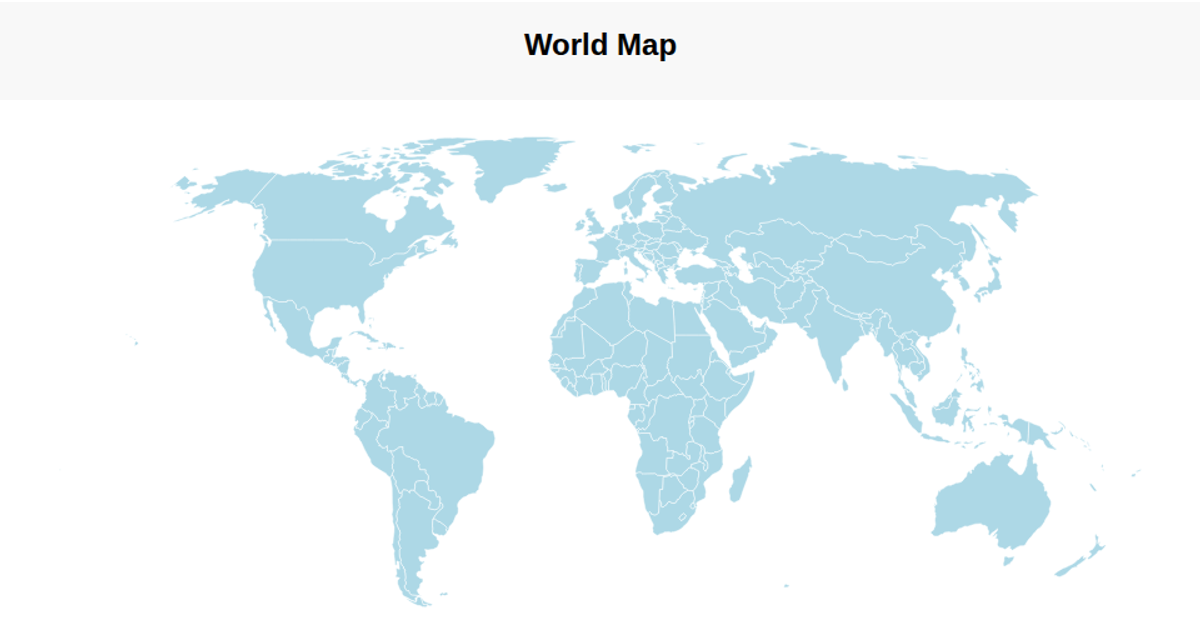
This visualization presents a world map using a geographic projection, rendering countries as black shapes with red outlines on a light blue sphere. It highlights countries on hover by changing their fill to orange. The code uses D3 v5 for geo-spatial functions like `geoEquirectangular`, `geoPath`, and `select`, while TopoJSON’s `feature` method converts the external GeoJSON data to map features. The map data is sourced from a world-atlas JSON file hosted via CDN.
AI-generated descriptionMIT Licensed




Comments
Sign in to join the discussion.