🌍 Public
reusable_Scatterplot
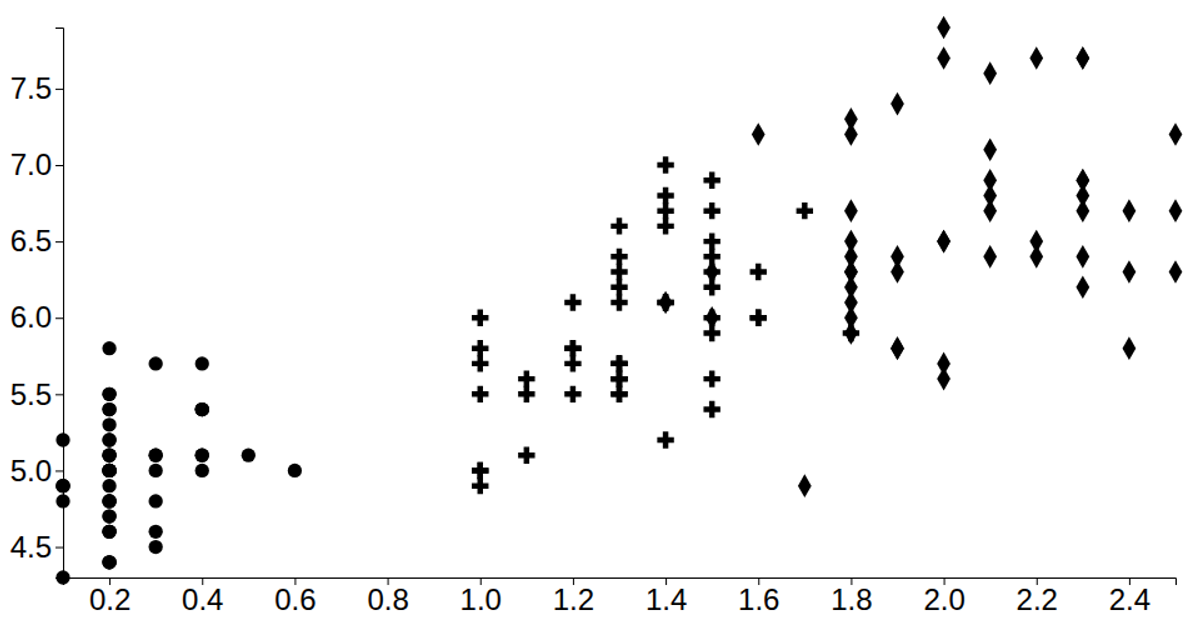
This scatterplot visualizes the Iris dataset, mapping petal length against sepal width, with points colored by species using a D3 ordinal color scale. The visualization is built with a reusable `scatterPlot` function that leverages D3 scales (`scaleLinear`, `scaleOrdinal`) and axes (`axisLeft`, `axisBottom`). Data is loaded asynchronously via `d3.csv` from a GitHub gist, and the SVG rendering is driven by a data-join pattern. The chart includes adjustable margins, point radius, and a toggleable path element.
AI-generated descriptionMIT Licensed






Comments
Sign in to join the discussion.