🌍 Public
reusable_Scatterplot_w_symbols
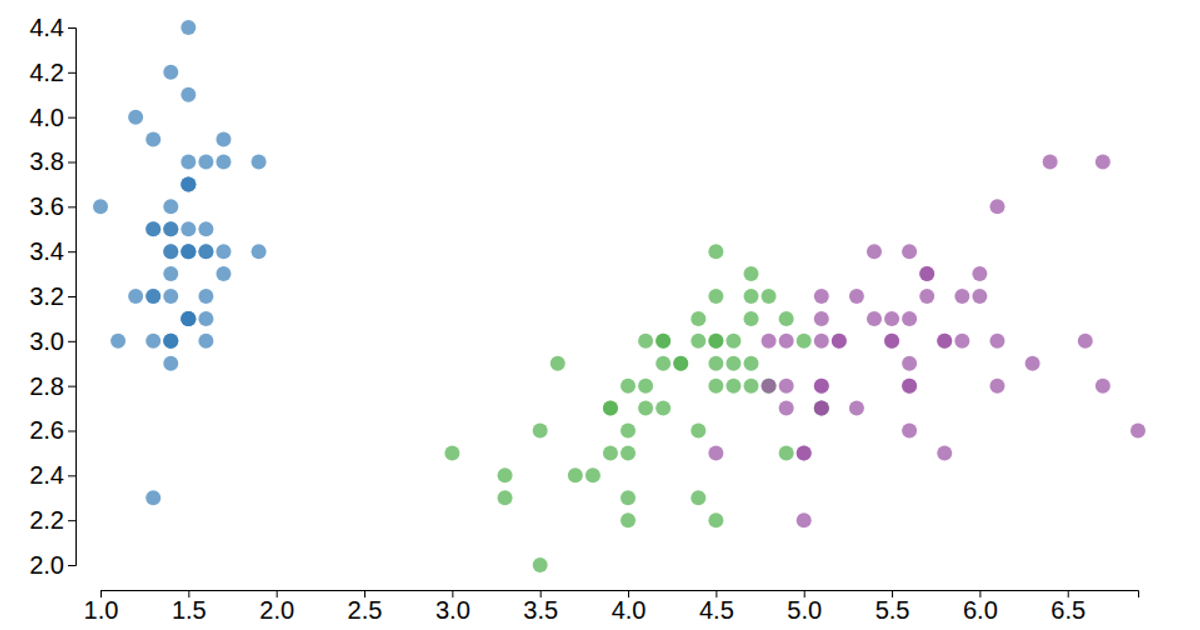
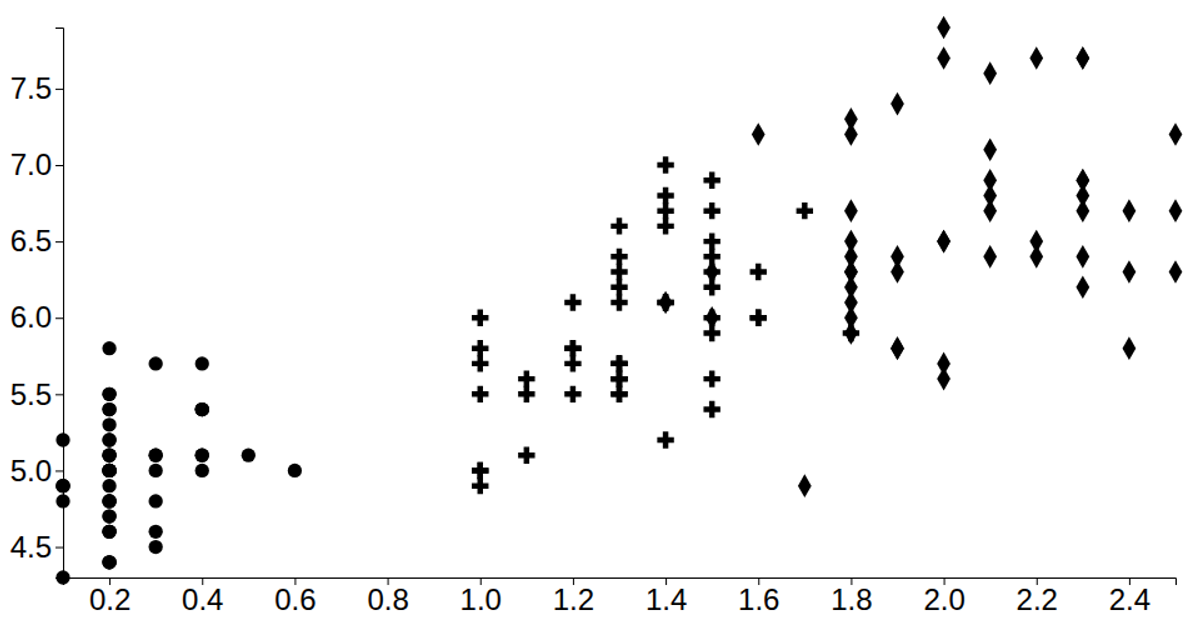
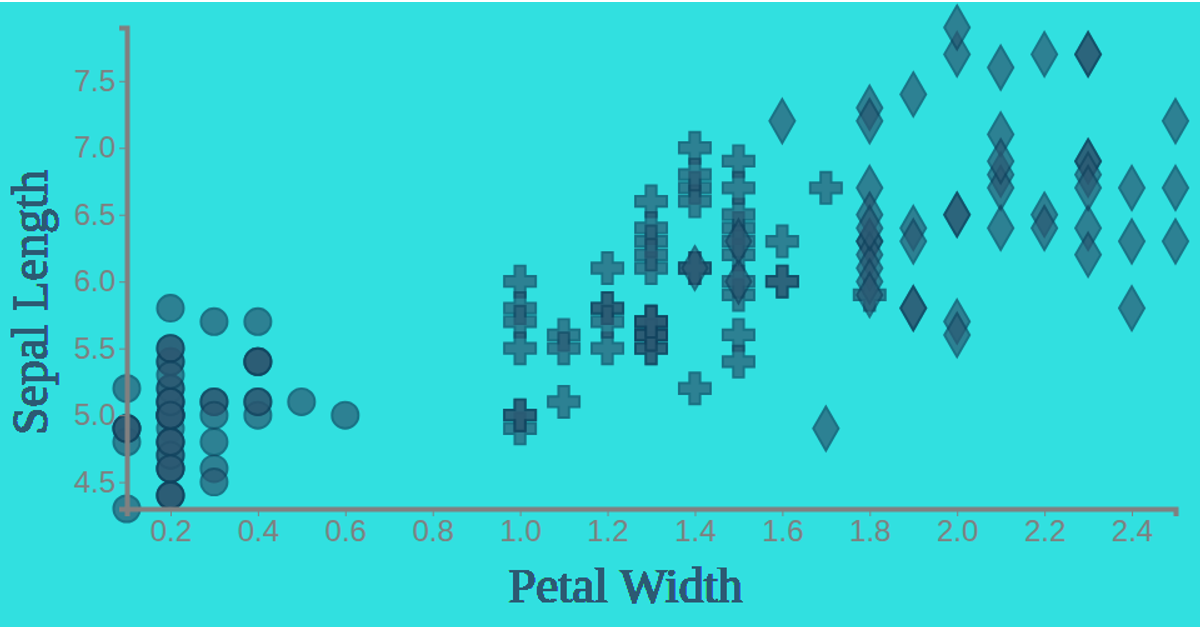
This example visualizes the Iris dataset as a scatterplot, mapping petal length and sepal width to x and y axes, with each species distinguished by both color and symbol shape. It uses D3 v7 with the reusable `scatterPlot` module, which applies D3 scales, ordinal color and symbol scales, and SVG path generation. Axes are rendered with `axisLeft` and `axisBottom`, while the toggle function hides or shows the line layer. Data is loaded asynchronously from a CSV via `d3.csv`.
AI-generated descriptionMIT Licensed





Comments
Sign in to join the discussion.