🌍 Public
Fork of making map 2
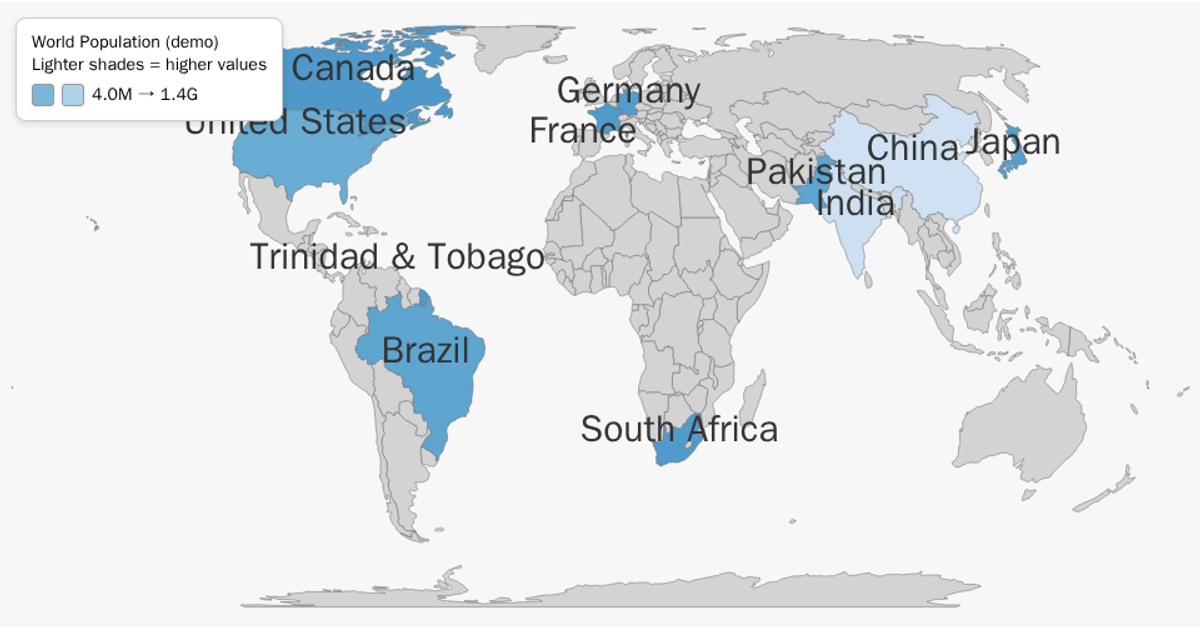
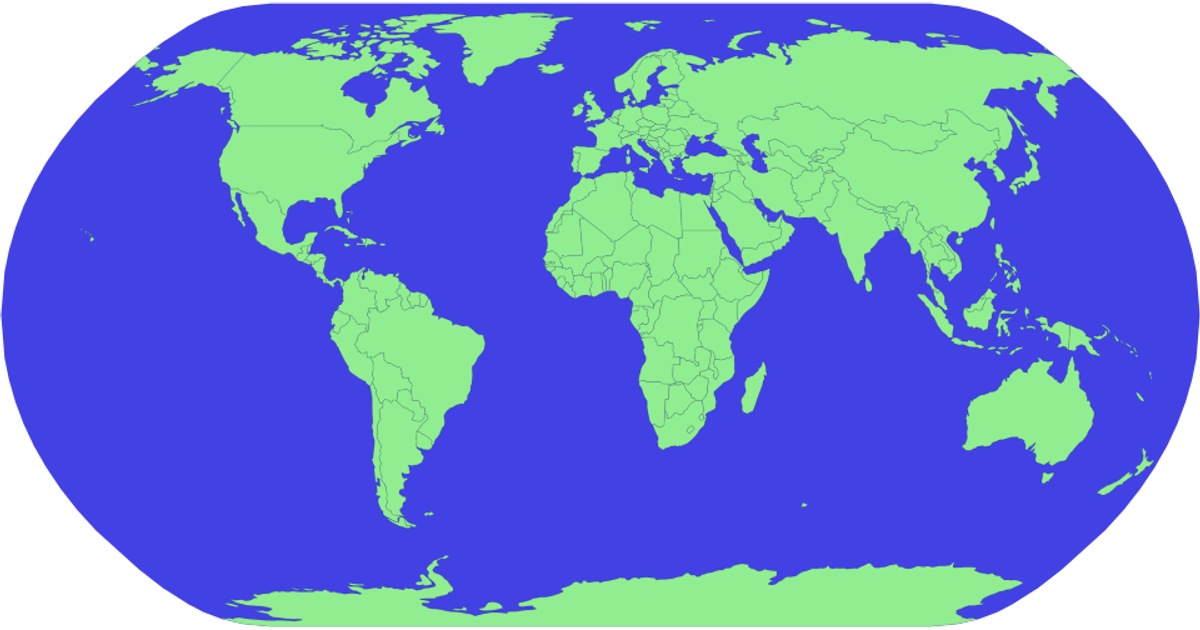
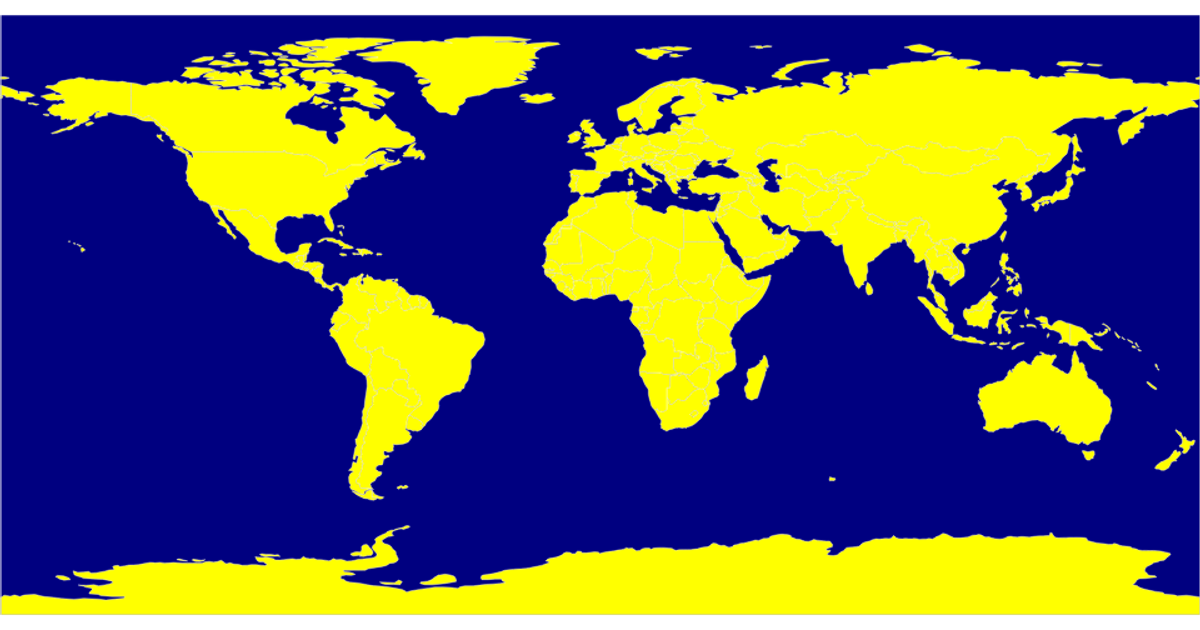
This world map visualizes 2022 renewable energy consumption percentages across countries, using a sequential green color scale where darker shades represent higher renewable energy usage. The visualization loads geographic boundaries from the world-atlas TopoJSON dataset and renders them as SVG paths using d3.geoPath with a natural Earth projection. The code creates a color mapping from an inline dataset of country-specific percentages and tooltips display exact values on hover. D3 v7 handles the data join, while the topojson library converts the geographic data into GeoJSON features for rendering.
AI-generated descriptionMIT Licensed




Comments
Sign in to join the discussion.