🌍 Public
Fork of Untitled
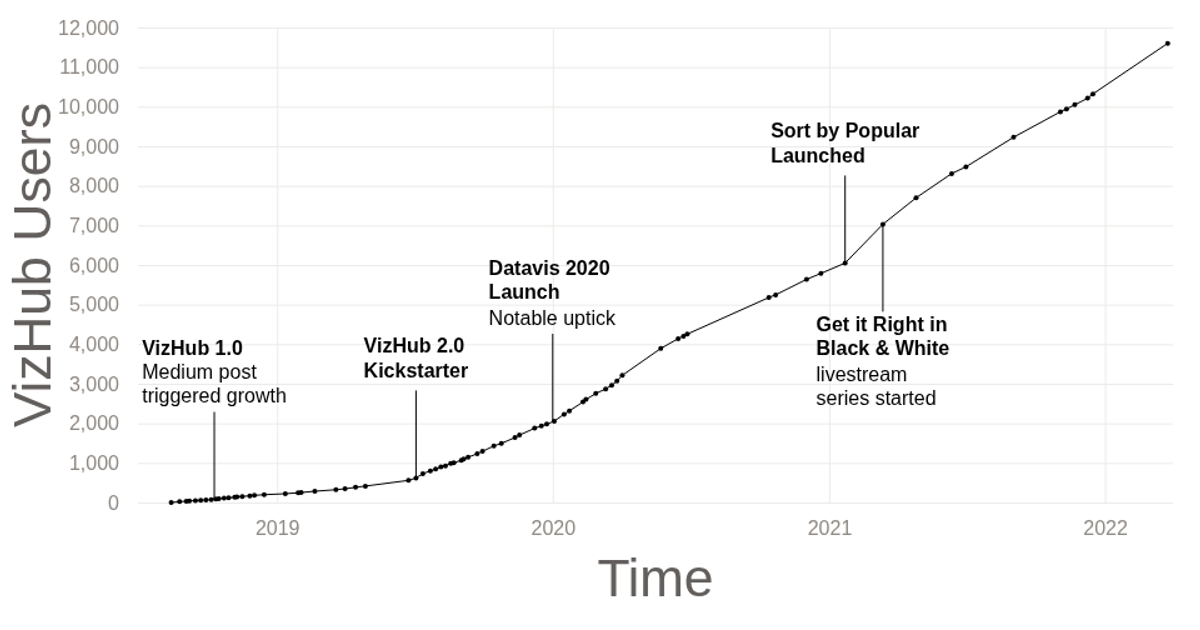
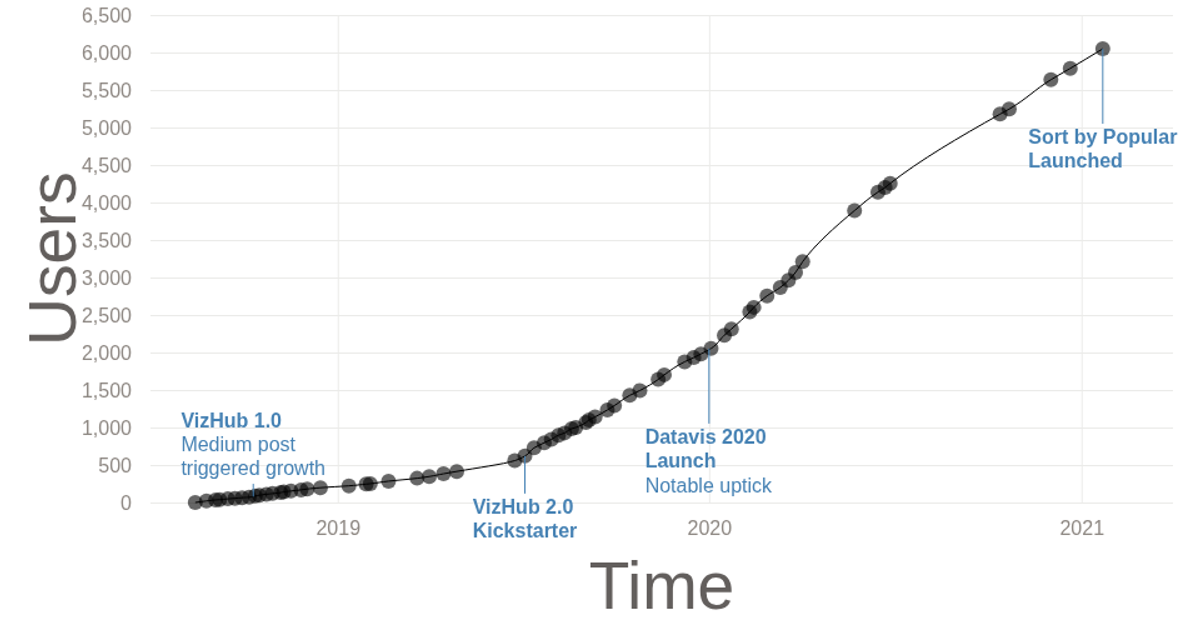
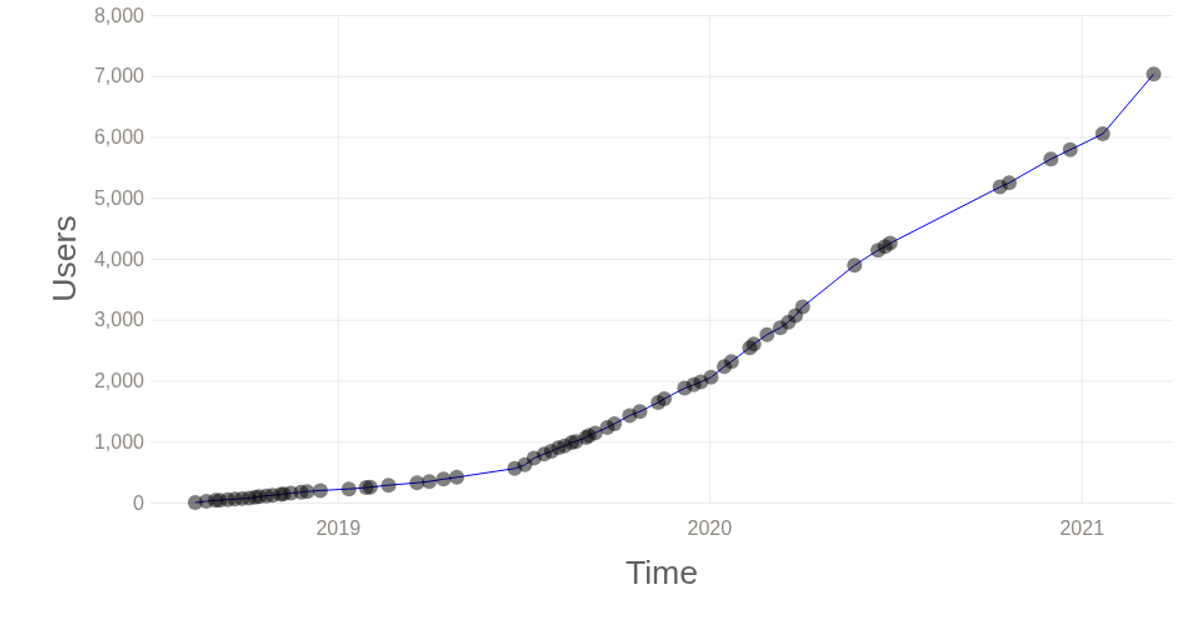
This example tracks the cumulative number of VizHub users since the platform’s launch on August 14, 2018. It displays a streamgraph where stacked, colored areas represent user growth over time, with a moving vertical cursor that highlights the current date. The visualization uses D3’s `d3.stack()` and `d3.area()` to construct the layered paths, while `d3.brushX()` and a custom `d3.scaleTime()` axis enable interactive time-window selection. Data is loaded from a local CSV file and rendered as an SVG with smooth transitions between brushed states.
AI-generated descriptionThe number of VizHub users over time, since it was launched on August 14, 2018.
MIT Licensed




Comments
Sign in to join the discussion.