Labeled US Map
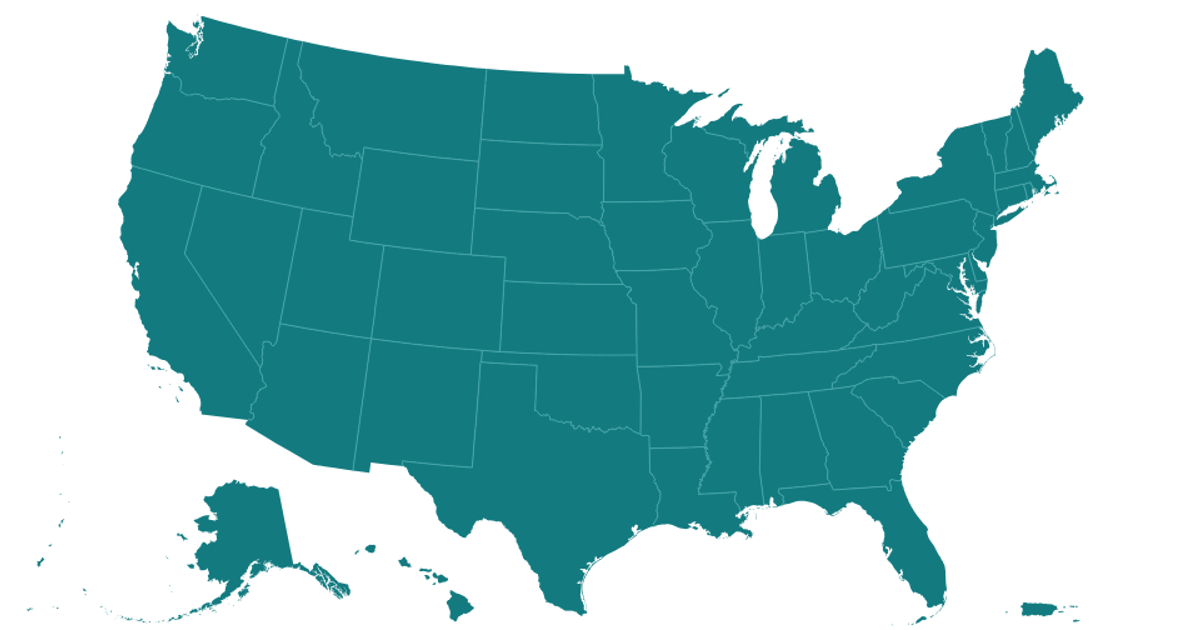
This example demonstrates a labeled map of the United States, including territories, rendered with React and D3 v5. Geographic features are drawn as polygons on a Canvas layer using `d3.geoPath`, while state names are positioned on top using an SVG layer and the `@datavis-tech/polylabel` algorithm for optimal label placement. The map uses an experimental `geoAlbersUsaTerritories` projection that extends the standard Albers USA projection to include Puerto Rico, Guam, and American Samoa, with state geometries loaded from TopoJSON via `topojson.feature`.
AI-generated descriptionA US map with labels (using an experimental Polylabel build) and an experimental map projection: Geo Albers USA with Territories.
This is really an experiment to see how VizHub can deal with moderate complexity.
Excerpted from Pleth.





Comments
Sign in to join the discussion.