🌍 Public
Labeled US Map
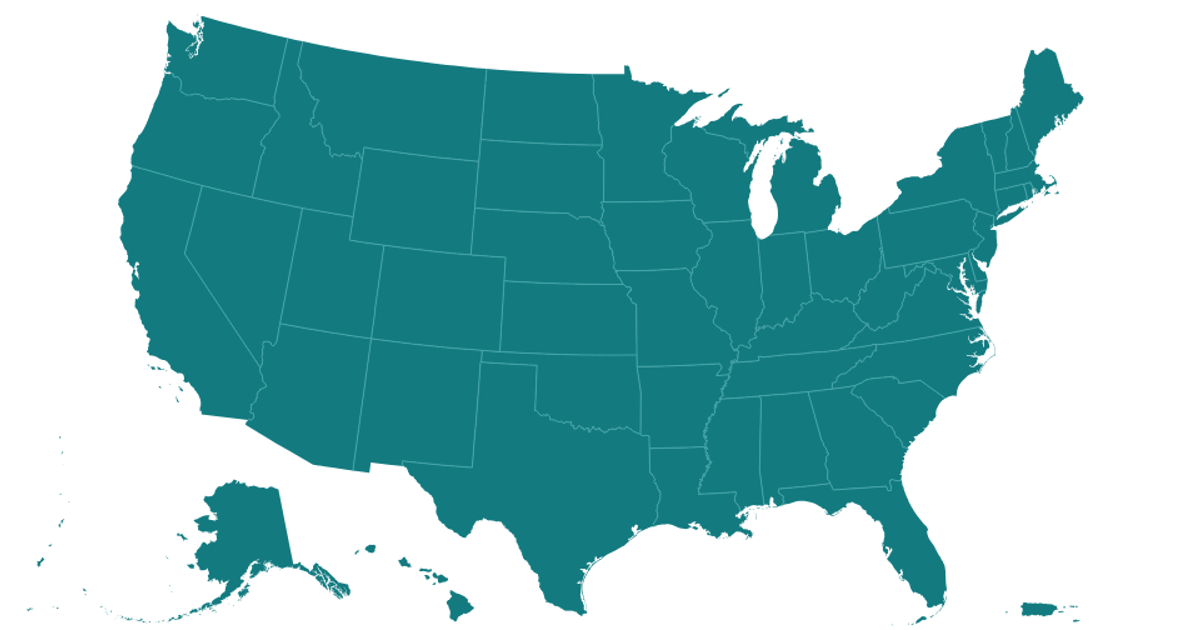
This example displays a labeled map of the United States, including territories, with state names positioned using polylabel for optimal label placement. The map uses a custom Albers USA projection with territories, rendering polygons on a Canvas layer and labels in an SVG layer. Built with React and D3 v5, it fetches state boundaries from TopoJSON, draws them with d3.geoPath, and caches geometry data asynchronously.
AI-generated descriptionA US map with labels (using an experimental Polylabel build) and an experimental map projection: Geo Albers USA with Territories.
This is really an experiment to see how VizHub can deal with moderate complexity.
Excerpted from Pleth.
MIT Licensed



Comments
Sign in to join the discussion.