🌍 Public
Making a Bar Chart!
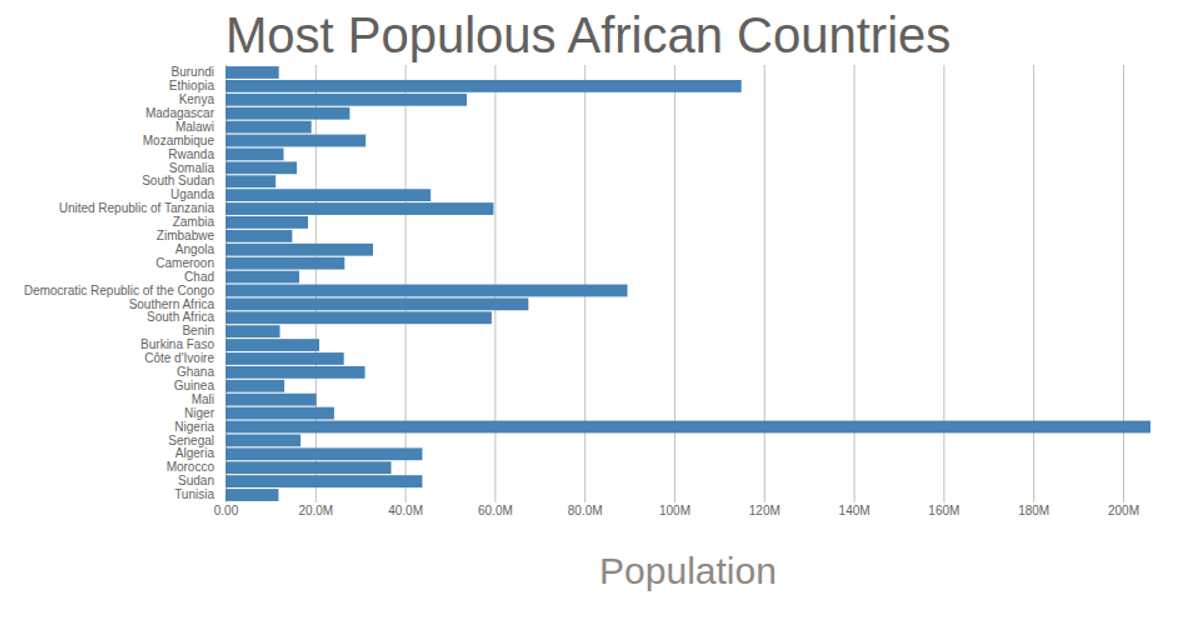
This bar chart displays the estimated 2015 populations of four African transboundary basins: Cuvelai, Limpopo, Okavango, and Zambezi, using data from the Africa Union. The visualization uses D3 v5 with an SVG rendering, employing `d3.scaleLinear` for the x-axis population scale and `d3.scaleBand` for the categorical y-axis. Axis labels are generated via `d3.axisLeft` and `d3.axisBottom`, while rectangular bars are appended dynamically to the SVG. The population values are converted from millions to raw numbers before scaling.
AI-generated descriptionThis bar chart shows population of the the four transboundary basin. The data comes from the year 2015 estimate in [Africa Union: Basin Population]
MIT Licensed




Comments
Sign in to join the discussion.