🌍 Public
slider
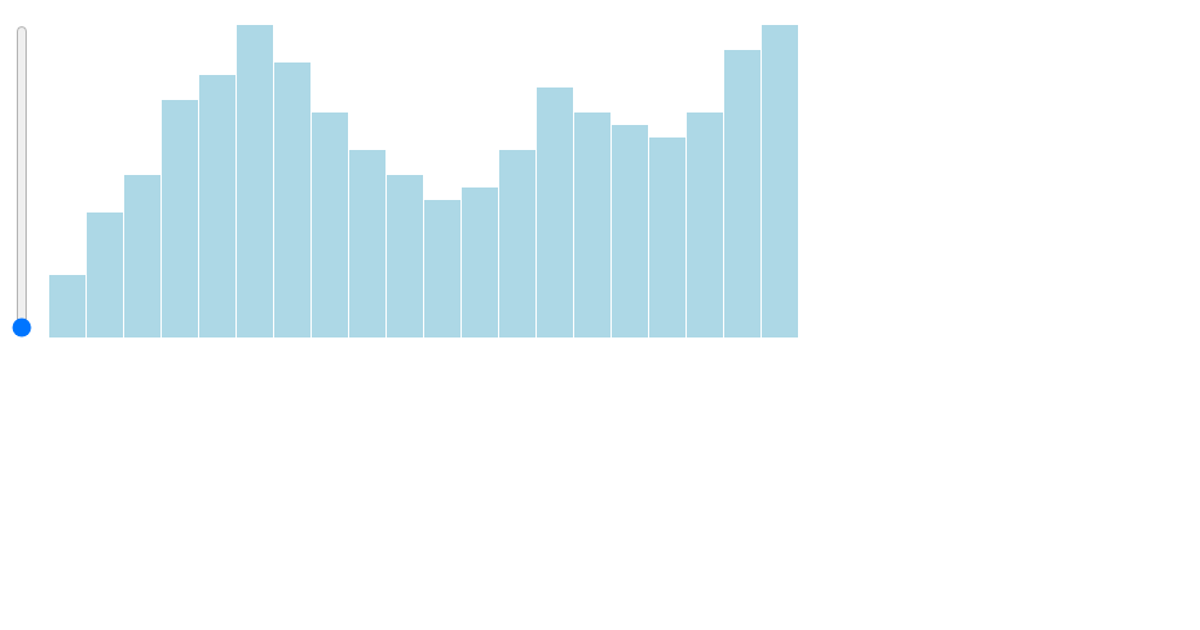
Two range sliders control the density and radius of a procedural circle texture applied to a rectangular SVG shape. Dragging either slider updates a texture generated with the `textures` library, which is then used as the rectangle’s fill via `textures.circles().size()` and `.radius()`. The SVG is rendered with d3.v4, which appends the rectangle to the chart area. Each slider also displays its current numeric value in an accompanying HTML paragraph.
AI-generated descriptionA bare minimum HTML page.
See also React Starter.
MIT Licensed




Comments
Sign in to join the discussion.