🌍 Public
Slider test 1
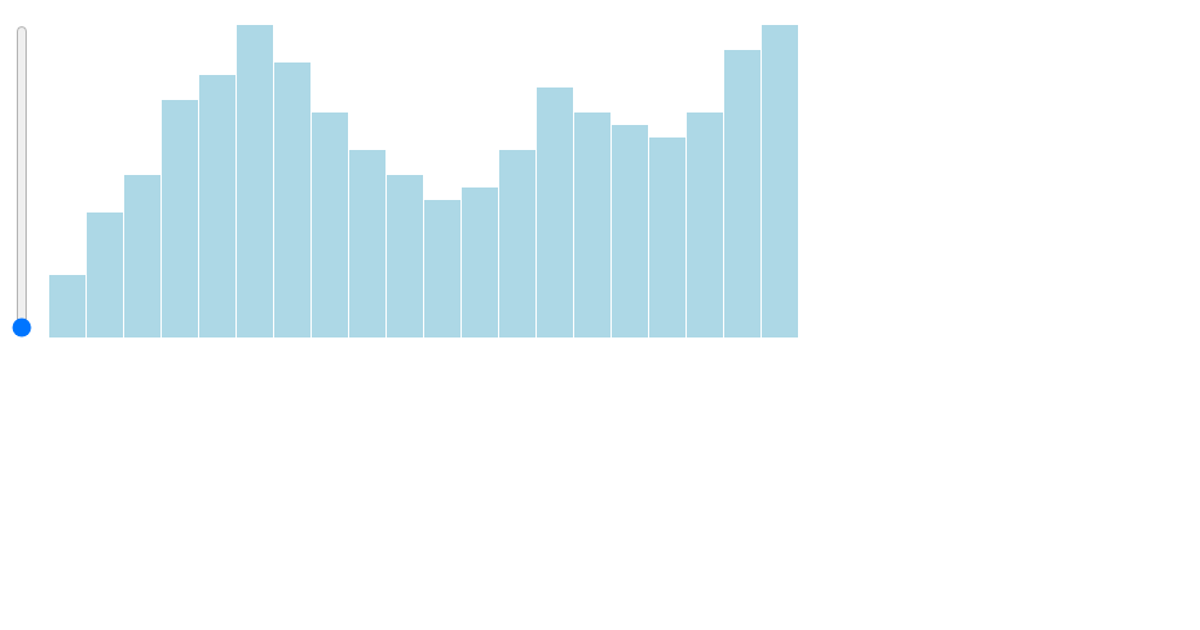
A range slider, built with the d3-simple-slider library, selects an interval on a horizontal axis. The slider’s default value is set between 0.015 and 0.02, and its current selection is displayed as a formatted percentage range in a paragraph. A D3 v6 SVG visualization renders the control, with the slider’s fill color set to blue. The underlying data, drawn from a CSV file, is not used in the interaction.
AI-generated descriptionMIT Licensed




Comments
Sign in to join the discussion.