🌍 Public
Scatter Plot Weighted by Size
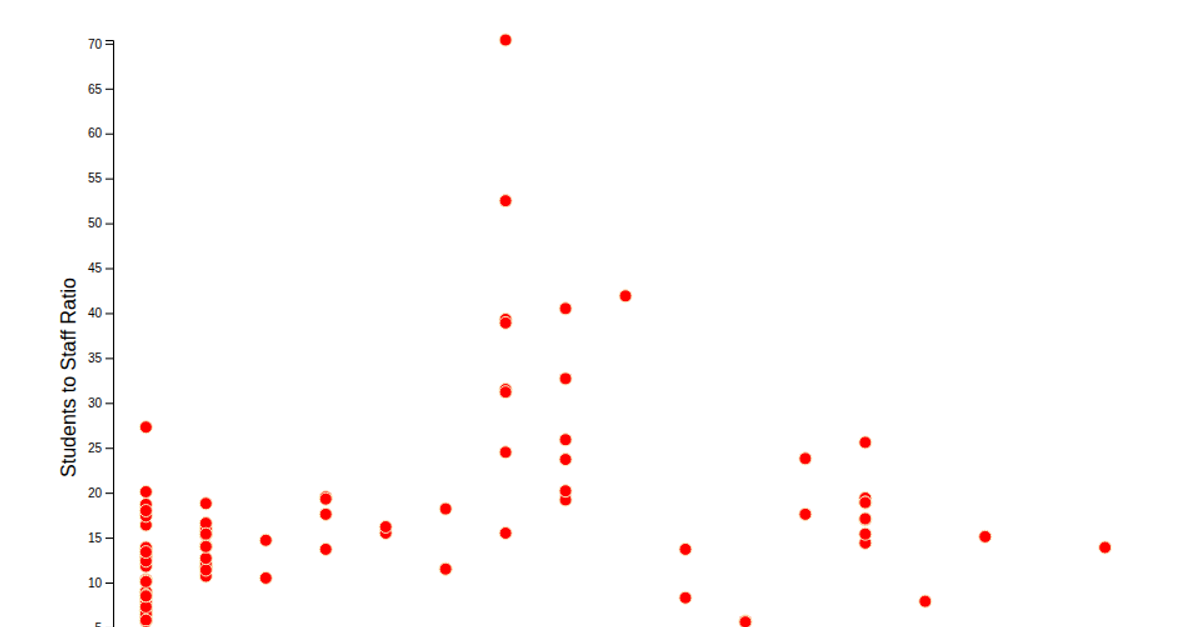
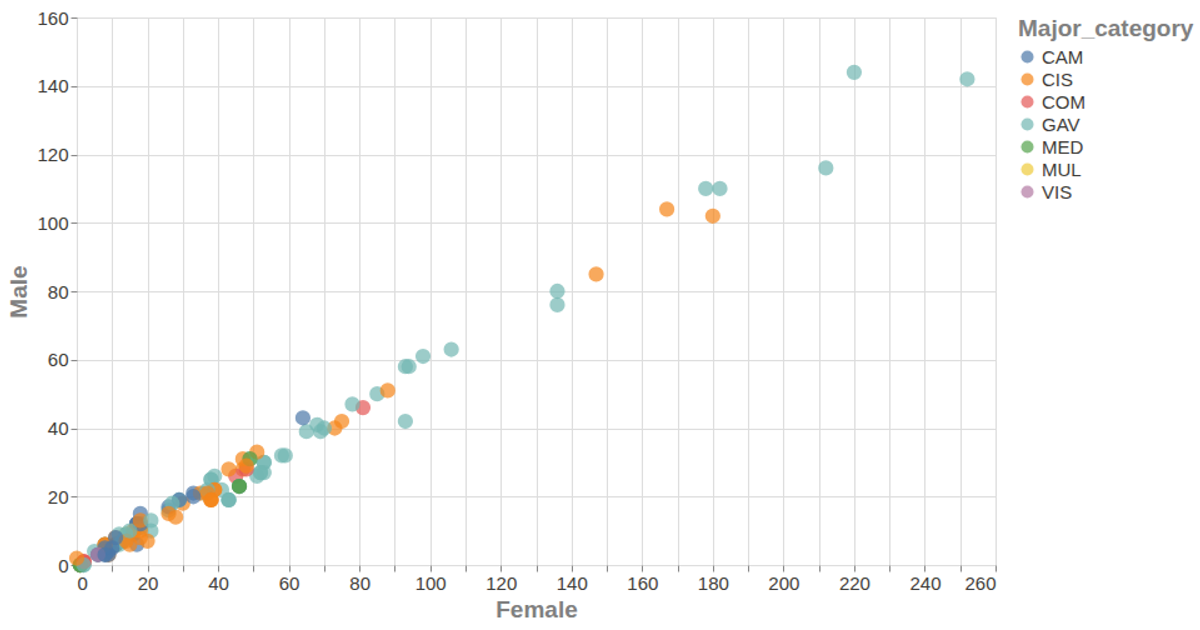
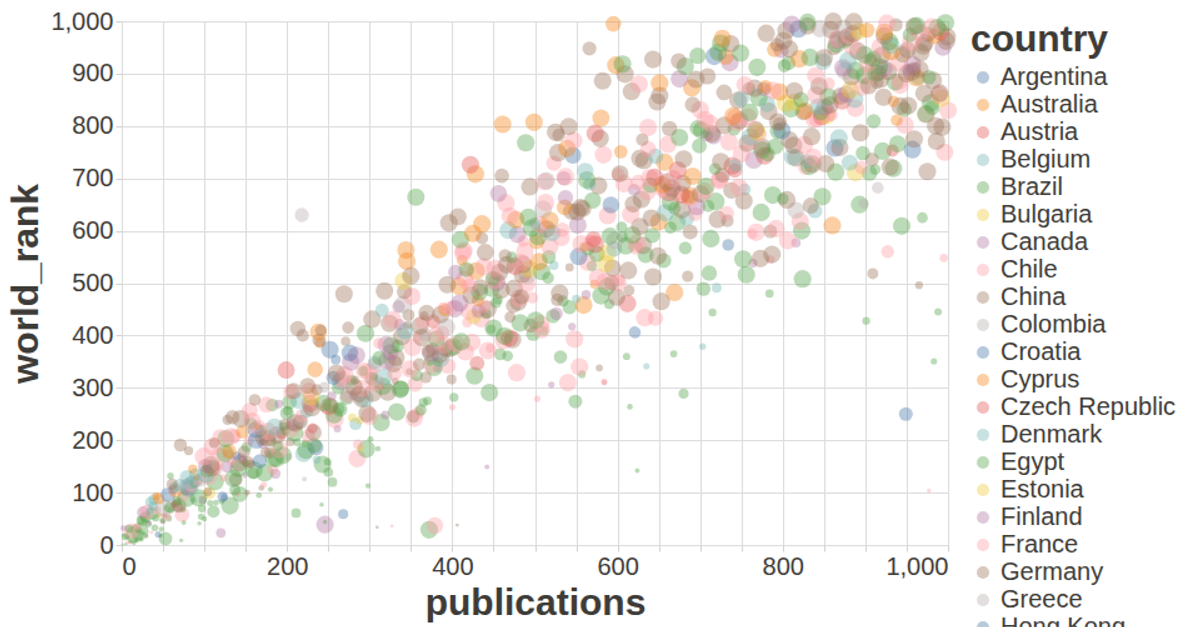
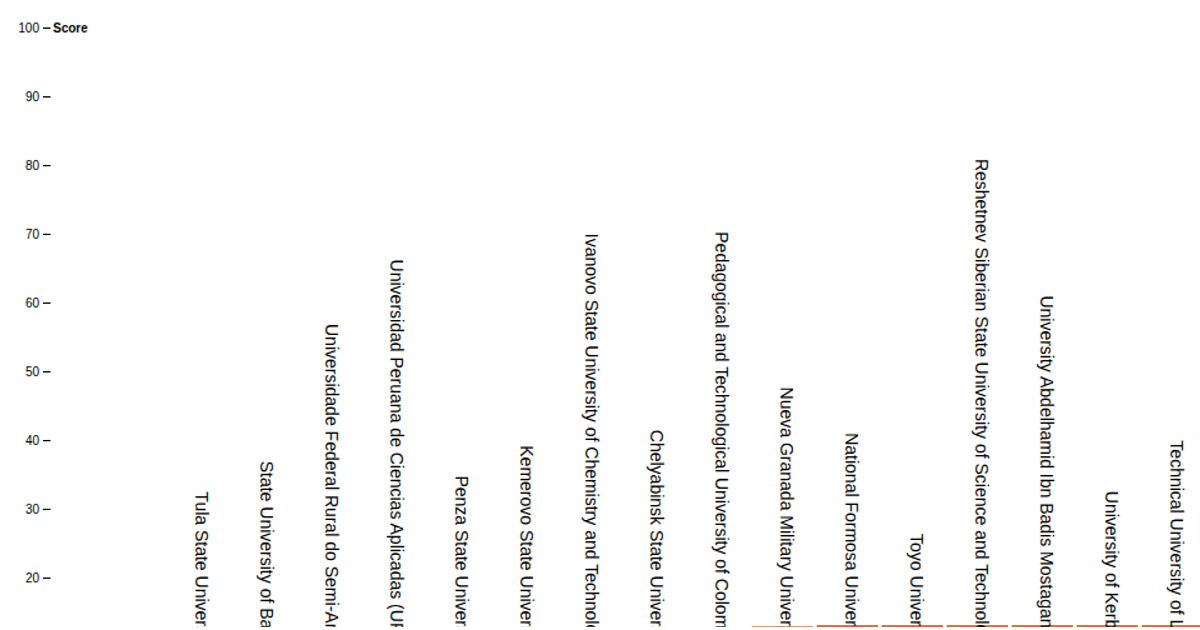
This scatter plot shows the number of universities across Thai provinces over time, with each point’s size weighted by the count of institutions. The visualization uses the vega-lite-api to render a point mark with an aggregated size encoding, reading data from a CSV of Thai higher education records. It customizes appearance through a vega-lite config for axis styles and tooltips, and loads data asynchronously via d3.csv.
AI-generated descriptionA visualization constructed using the vega-lite-api.
The visualization comes from Data.World : Thai Higher Education. It's designed to emphasize the number of university across Thailand by Year, group by the province.
MIT Licensed




Comments
Sign in to join the discussion.