A visualization constructed using the vega-lite-api.
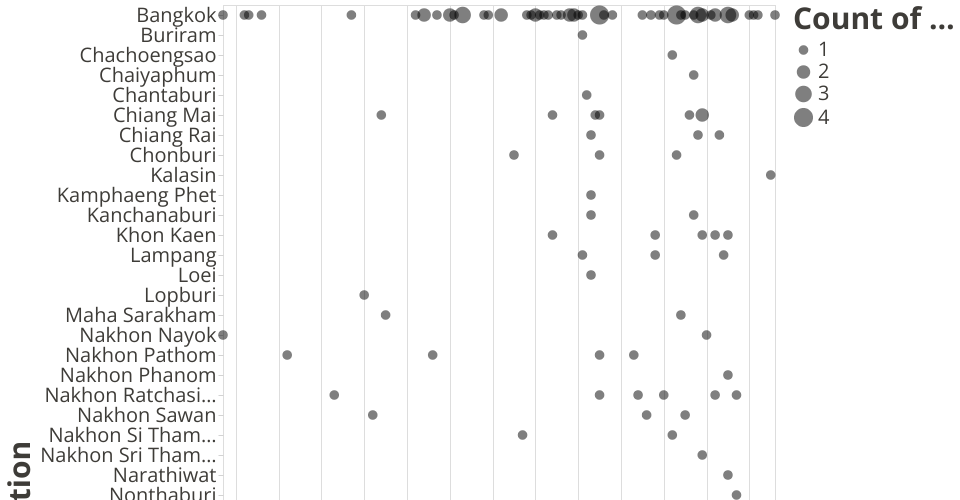
The visualization comes from Data.World : Thai Higher Education. It's designed to emphasize the number of university across Thailand by Year, group by the province.
MIT Licensed
A visualization constructed using the vega-lite-api.
The visualization comes from Data.World : Thai Higher Education. It's designed to emphasize the number of university across Thailand by Year, group by the province.