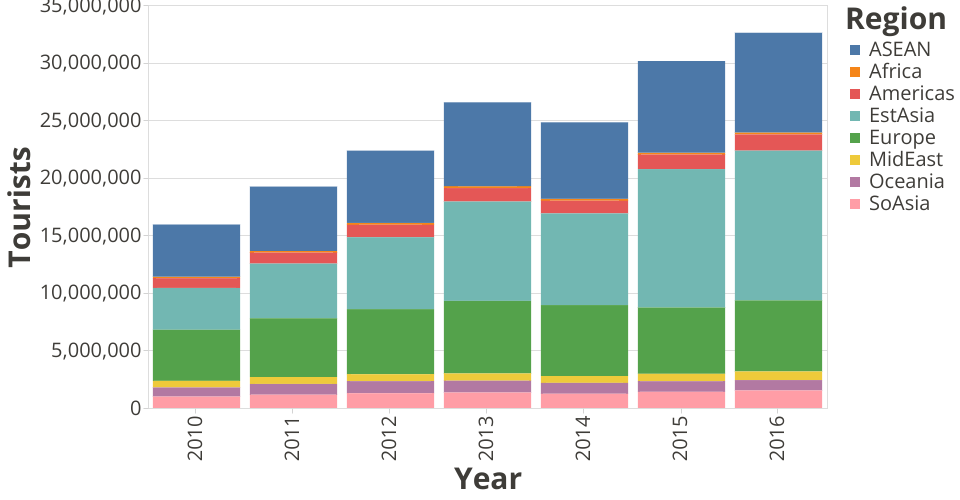
A visualization constructed using the vega-lite-api.
The visualization comes from Data.World : Thai Tourism Data Set. It's designed to emphasize the number of "tourists coming to Thailand" each year, aggregating by the regions. Each stacked bar represented the total number of tourists.
MIT Licensed