🌍 Public
Final
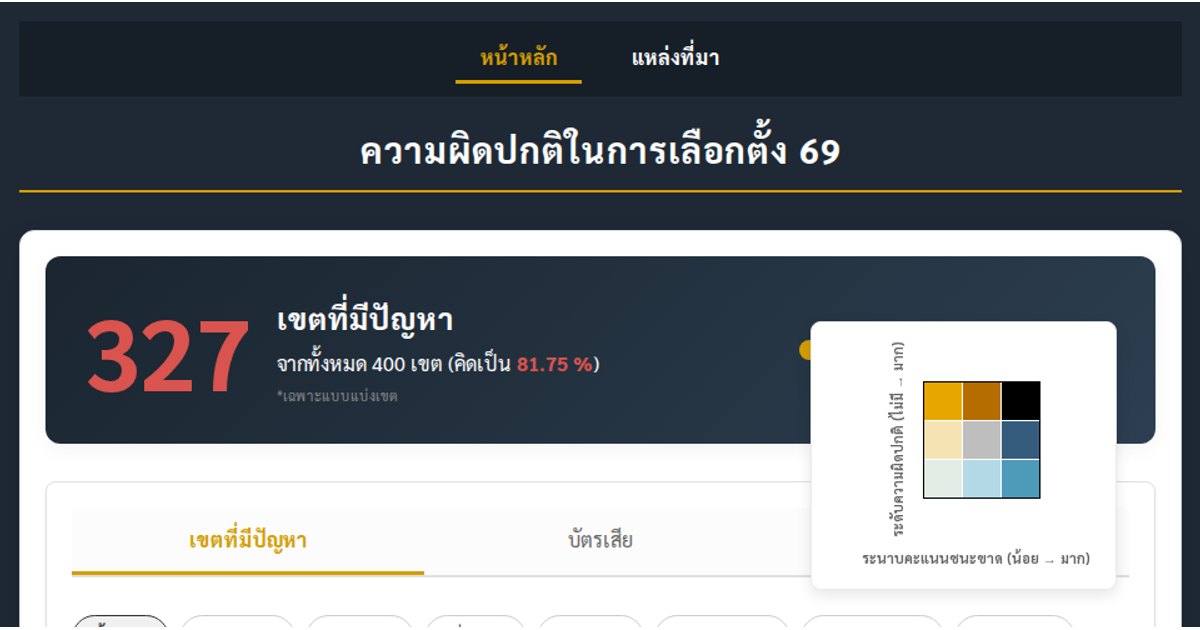
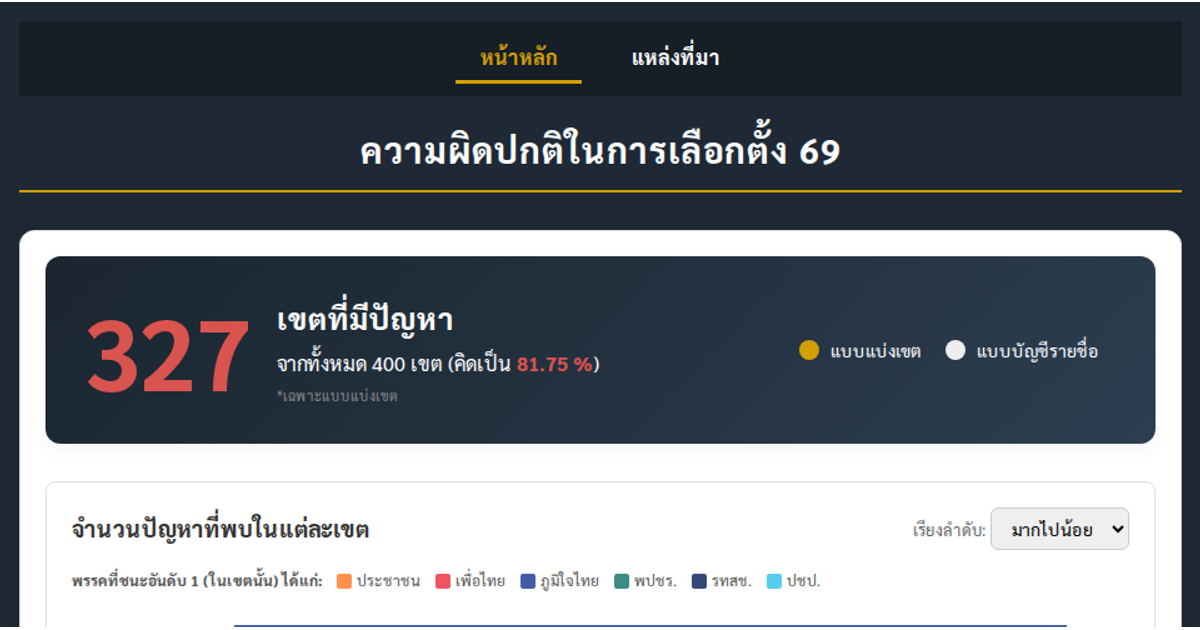
This dashboard visualizes Thai election irregularities across constituencies, comparing problems, invalid ballots, and voter turnout between district and party-list votes. It uses a choropleth map with D3’s `geoPath`, animated bar charts, pie charts, and a scatter plot with trend lines to reveal relationships between vote margins and reported anomalies. All charts are built with D3 v7, rendering SVG elements with tooltips and interactive radio-button filters, using data from MainPointComplete.csv.
AI-generated descriptionMIT Licensed




Comments
Sign in to join the discussion.