🌍 Public
Fork of Final
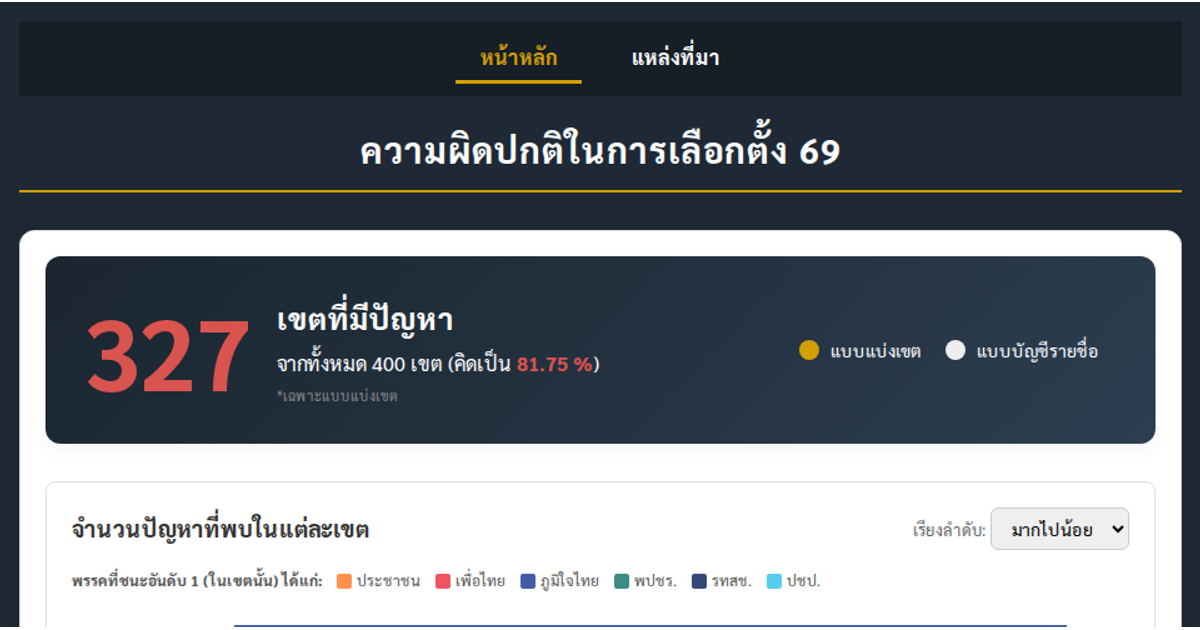
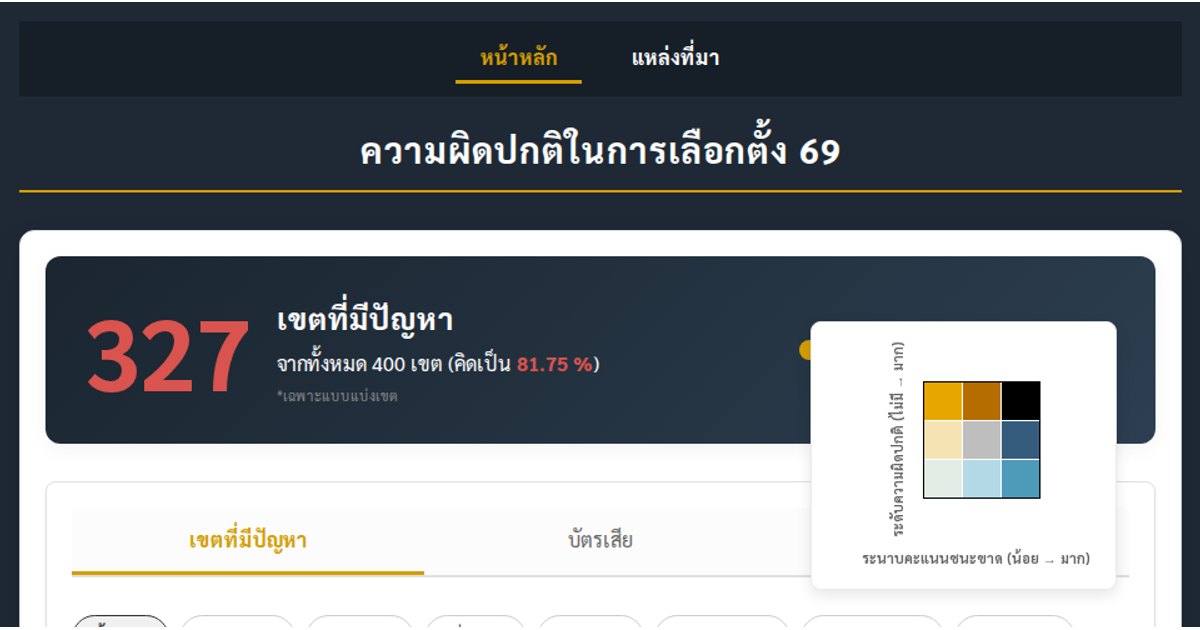
This dashboard visualizes election irregularities across Thailand, presenting an interactive map, bar chart, pie chart, and scatter plot. It uses D3.js v7 to render SVG and animated transitions, allowing users to switch between constituency and party-list data, and to filter by political party. The visualization explores relationships between vote margins, reported problems, invalid ballots, and voter turnout, with tooltips providing detailed statistics for each district. Data is loaded from a CSV file containing election results and anomaly indicators.
AI-generated descriptionMIT Licensed




Comments
Sign in to join the discussion.