🌍 Public
Fork of Scatter Plot with Menus and Colour and Legend
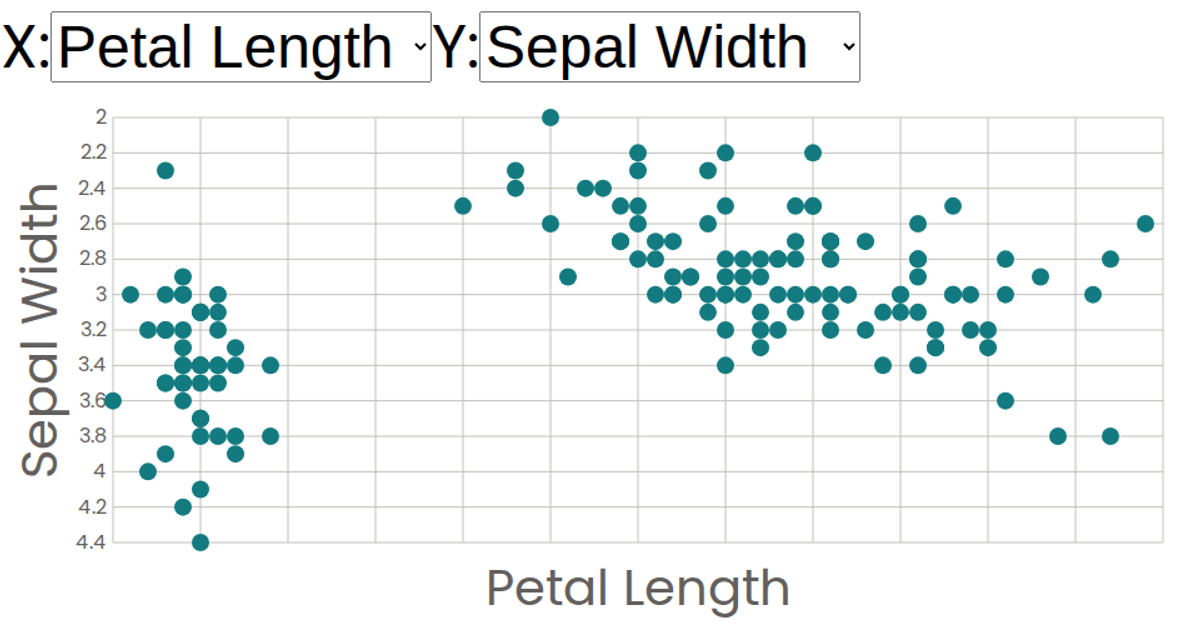
This interactive scatter plot visualizes the Iris dataset, letting users explore relationships between four flower measurements by switching the X and Y axes via dropdown menus. Each point is colored by species, with a legend clarifying the color encoding. The visualization is built with React functional components and renders SVG marks using D3 v5 scales. It leverages `d3.scaleLinear` for axes, `d3.scaleOrdinal` for categorical colors, and React state hooks to manage attribute selections.
AI-generated descriptionA scatter plot of The Iris Dataset.
MIT Licensed




Comments
Sign in to join the discussion.