🌍 Public
Fork of Scatter Plot with Menus
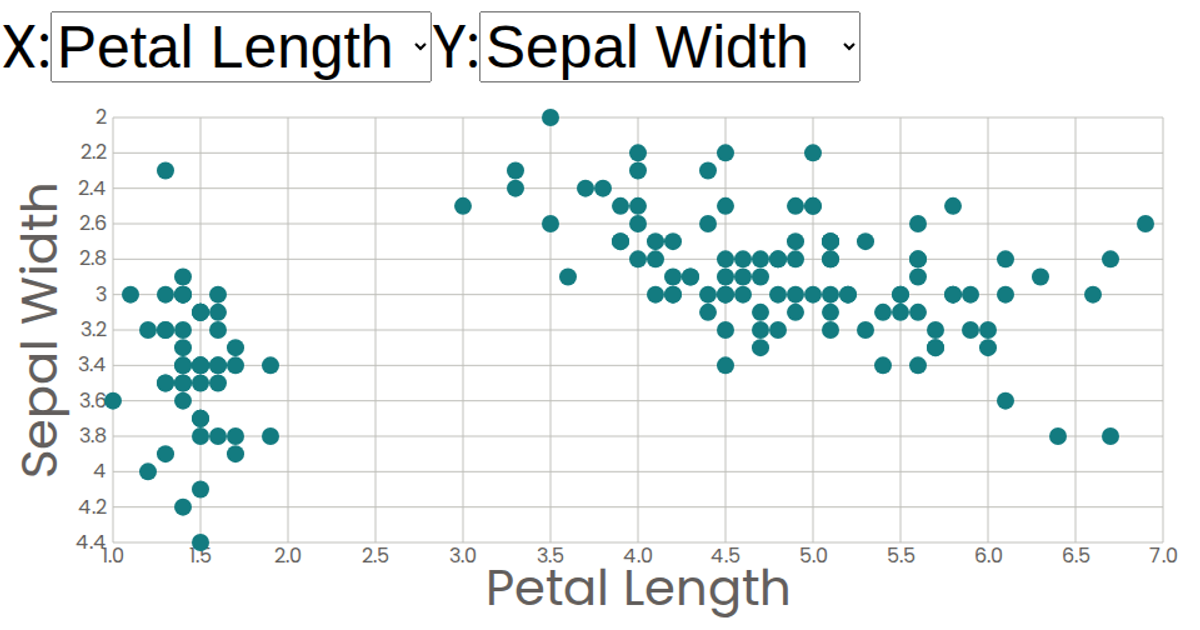
This interactive scatter plot visualizes the Iris Dataset, allowing the selection of any of its four numerical attributes for the x and y axes through dropdown menus. Built with React and D3, the visualization uses `scaleLinear` to map data to SVG coordinates, rendering circles with tooltips that display formatted values. Axis labels and tick marks are controlled by custom components, providing a flexible exploration of relationships between sepal and petal measurements.
AI-generated descriptionA scatter plot of The Iris Dataset.
MIT Licensed




Comments
Sign in to join the discussion.