🌍 Public
Activity 6_Task 3.2_Question
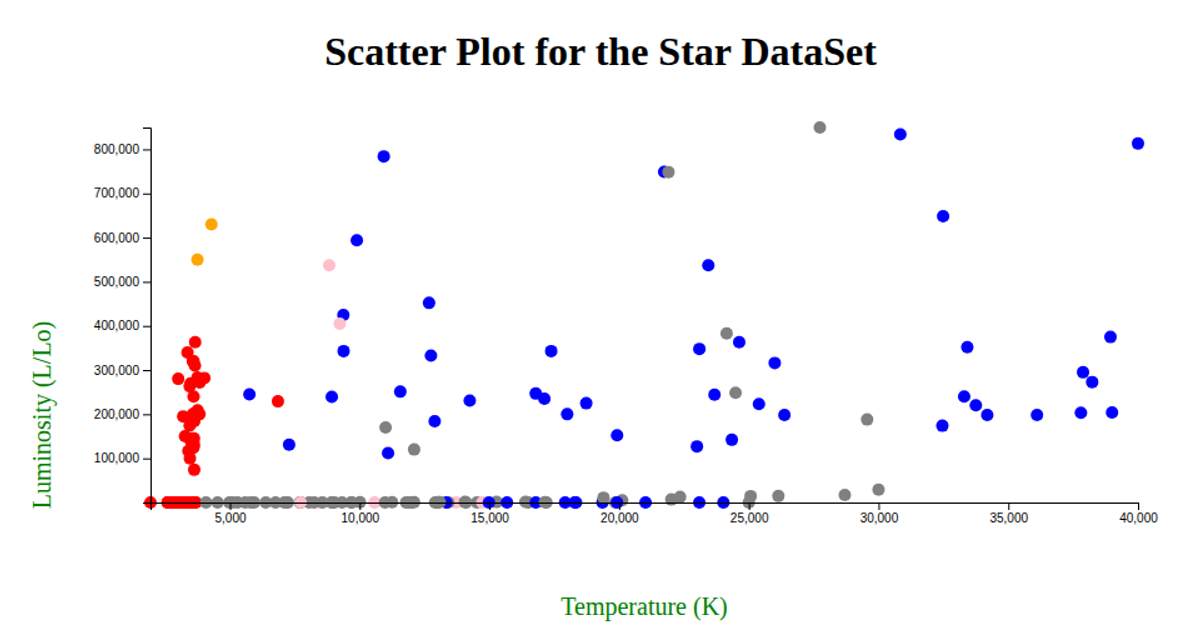
This scatter plot visualizes star data from a CSV file, showing the relationship between Temperature (K) on the x-axis and Luminosity (L/Lo) on the y-axis. Each star is represented by a distinct symbol, colored according to its star color category, with a legend indicating the mapping. The visualization uses d3.scaleLinear for axis scaling, d3.scaleOrdinal with d3.symbolsFill for shape assignment, and d3.symbol to generate the shapes for both the marks and legend. Data is loaded via fetch and parsed with d3.csvParse.
AI-generated descriptionMIT Licensed




Comments
Sign in to join the discussion.