🌍 Public
Activity 7.1_Tutorial
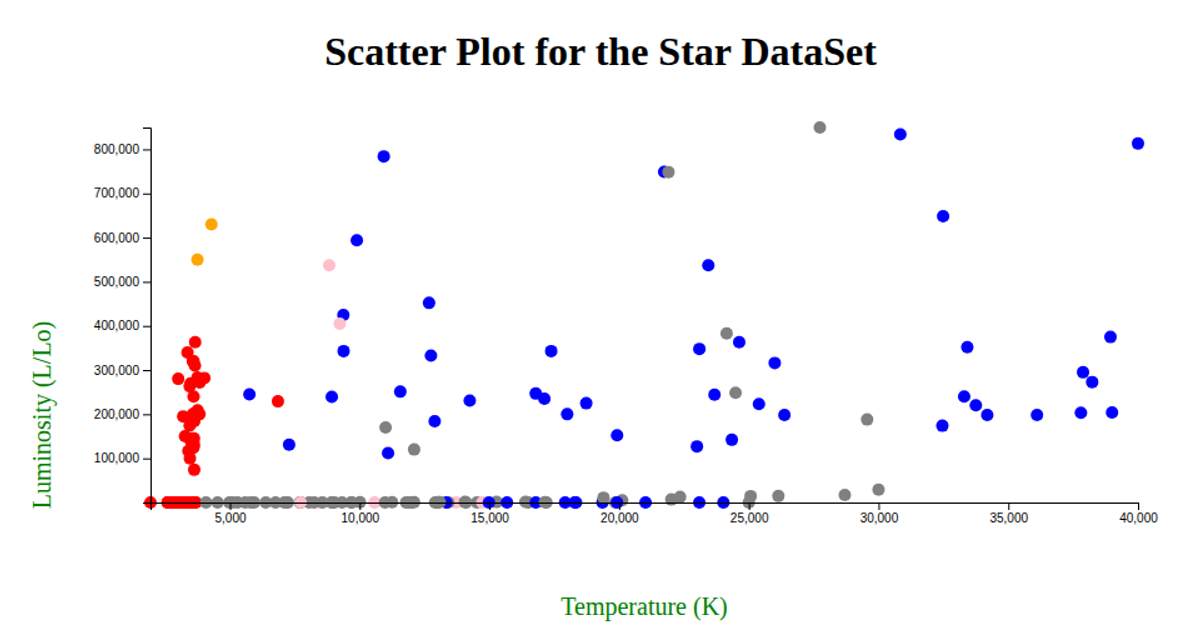
This interactive scatter plot visualizes the Star DataSet, mapping stellar temperature (K) on the x-axis against luminosity (L/Lo) on the y-axis. Each circle represents a star, with its fill color determined by the star’s spectral color category (e.g., red, blue, yellow, orange) via a custom color map, falling back to gray for unknown colors. The visualization uses d3.csv to load the remote dataset, d3.scaleLinear for both axes, and d3.axisLeft and d3.axisBottom for the labeled axes, with margins and axis labels provided in green. The chart renders as an SVG, sized to the full browser window, and includes a descriptive title above the plot.
AI-generated descriptionMIT Licensed





Comments
Sign in to join the discussion.