🌍 Public
Organization Network Graph_5
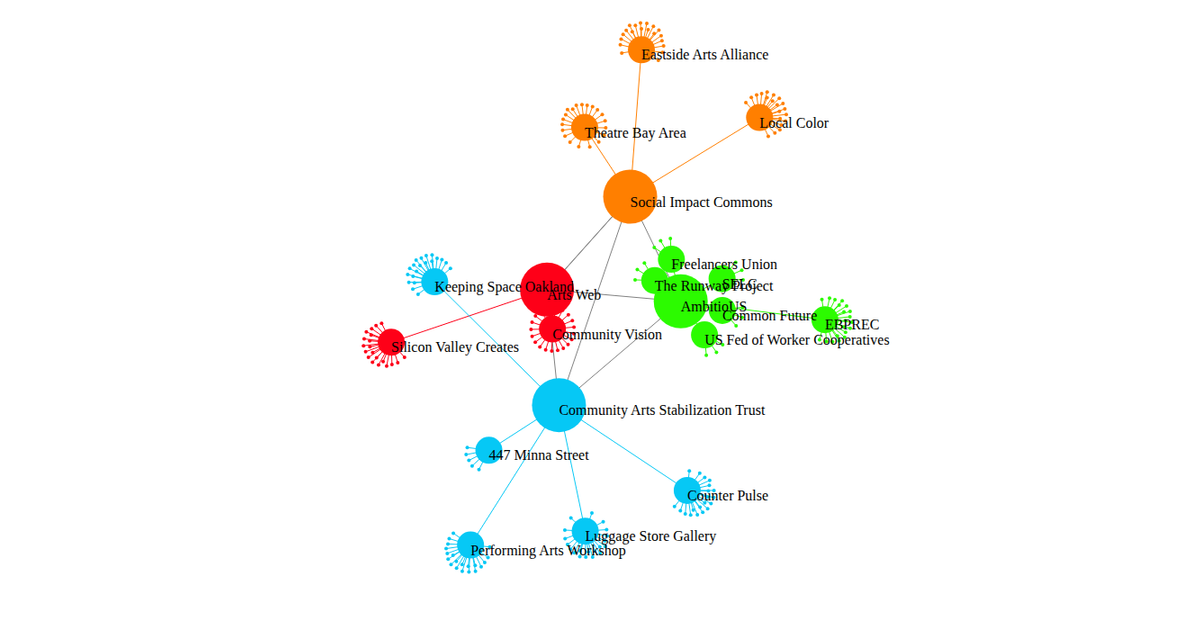
An interactive force-directed network graph displays the relationships between five main organizations and their affiliated child nodes, each color-coded by the main organization. The simulation uses d3.forceSimulation with a many-body charge force, link constraints, and a centering force to position nodes, while drag interaction lets users manipulate the layout. Nodes are rendered as SVG circles, links as lines, and labels as text elements, with the data generated programmatically in the included data.js file.
AI-generated descriptionMIT Licensed


Comments
Sign in to join the discussion.