🌍 Public
2020 Studying abroad number!
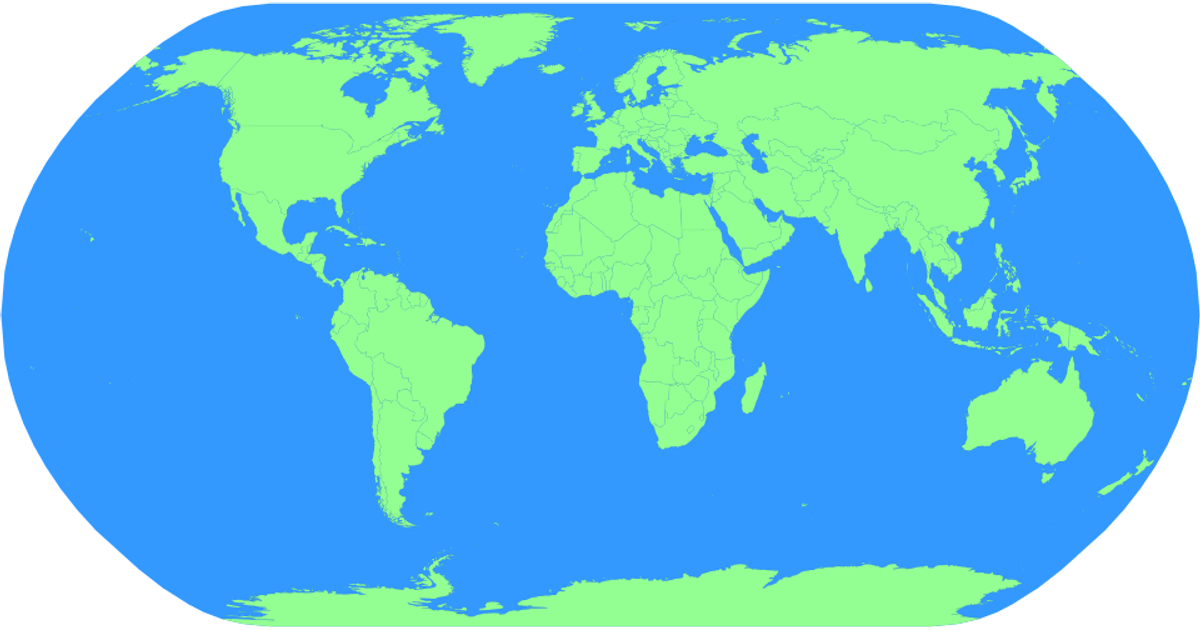
This choropleth map visualizes 2020 study-abroad numbers by country, with darker reds indicating higher counts. It loads world geometry and country names from the world-atlas TopoJSON/TSV files, joins them to the provided data.json, and renders paths with d3.geoPath and a d3.scaleSequential color scale. Hovering highlights countries green, and d3.zoom enables interactive panning and zooming.
AI-generated descriptionDemonstrates fundamental DOM manipulation using D3.js by making a smiley face whose eyebrows move.
MIT Licensed




Comments
Sign in to join the discussion.