🌍 Public
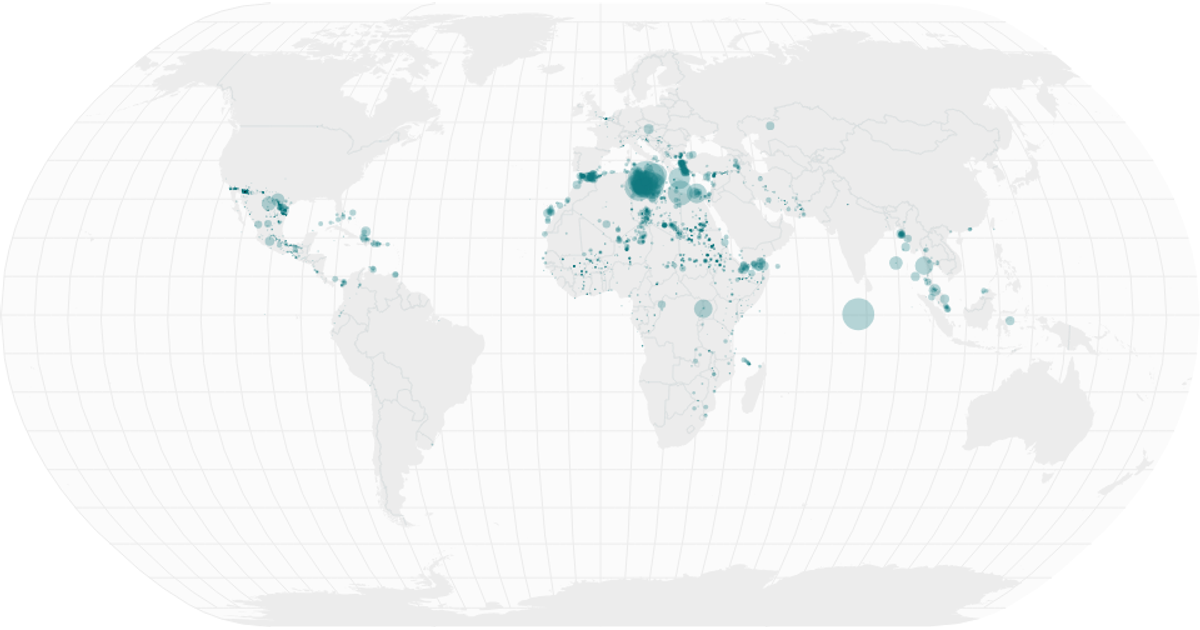
Missing Migrants on World Map
A world map uses natural Earth projection and semi-transparent circles to visualize the geographic distribution of missing migrants, with circle size encoding the total number of dead and missing per location. A linked date histogram below the map uses d3.bin for monthly aggregation and a brushX brush to filter the displayed data by date range. The visualization is built with React, d3.v5, and topojson, rendering geoPath for land masses, graticules, and interior boundaries from World Atlas TopoJSON data.
AI-generated descriptionA world map showing country boundaries from World Atlas TopoJSON, polished for visual style, including graticules.
MIT Licensed


Comments
Sign in to join the discussion.