Pie Chart
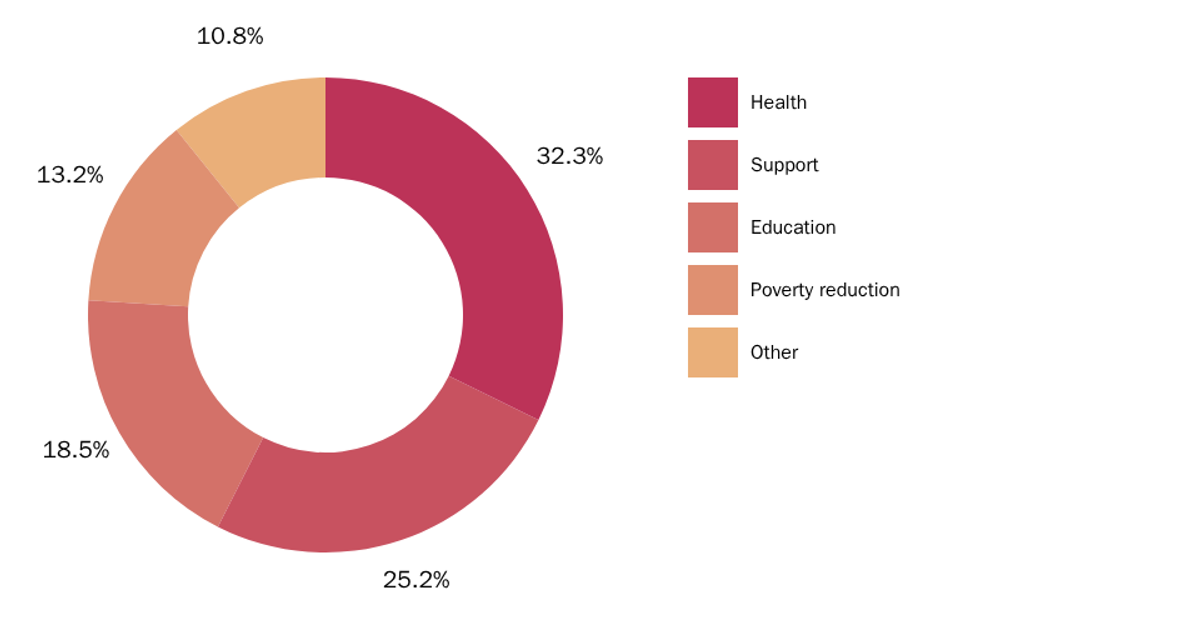
A donut chart displays the ten most common cocktail ingredients from a Hotaling & Co. dataset, ranked by frequency of use across recipes. The React app loads CSV data via `d3.csv`, aggregates counts with `d3.nest()`, and sorts results in descending order before slicing to the top ten. D3’s `pie()` generator computes arc angles, while the `arc()` generator renders SVG paths with an inner radius for the donut effect. Hovering reveals ingredient names and counts through native SVG `<title>` tooltips.
AI-generated descriptionThis visualization is based on the dataset of cocktails collected by alcohol importer and distiller Hotaling & Co. The original dataset was modified to parse out and clean up the ingredients into rows.
The chart demonstrates a basic donut chart showing top 10 cocktail ingredients. The goal is to have one of these at each location in the final map.


Comments
Sign in to join the discussion.