This visualization is based on the dataset of cocktails collected by alcohol importer and distiller Hotaling & Co. The original dataset was modified to parse out and clean up the ingredients into rows.
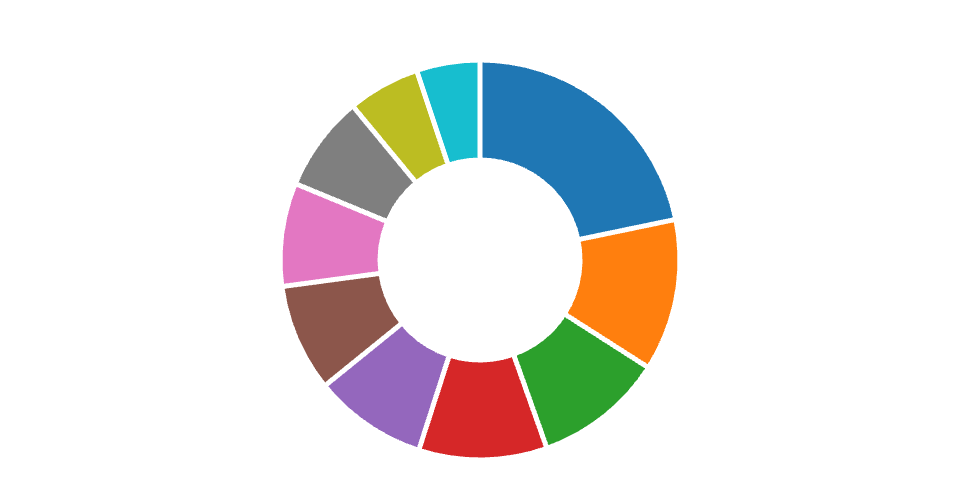
The chart demonstrates a basic donut chart showing top 10 cocktail ingredients. The goal is to have one of these at each location in the final map.
MIT Licensed