🌍 Public
Activity8-T3
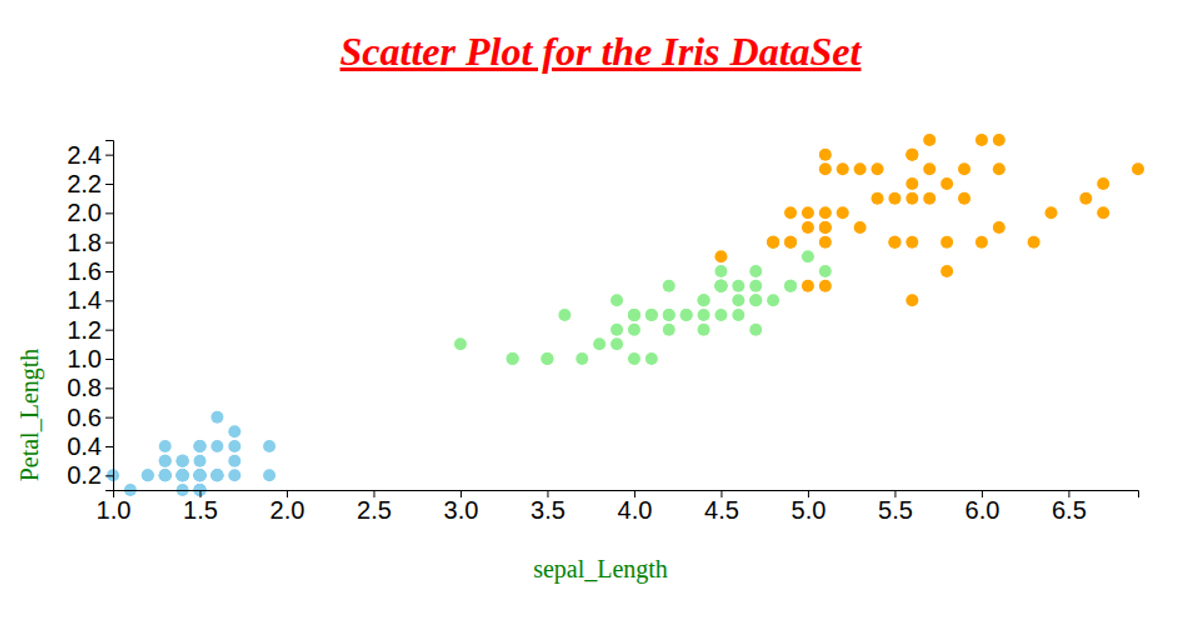
A scatter plot of the Iris dataset displays petal length on the x-axis and petal width on the y-axis, with points colored by species (setosa, versicolor, virginica). The visualization uses D3 v6 with `select`, `scaleLinear`, `extent`, `axisLeft`, and `axisBottom` to render SVG circles, each with a fixed radius. Data is loaded asynchronously from a GitHub-hosted CSV, and axes are labeled with rotated text. The chart fills the browser window using `window.innerWidth` and `window.innerHeight`.
AI-generated descriptionMIT Licensed


Comments
Sign in to join the discussion.