🌍 Public
Activity8-T3
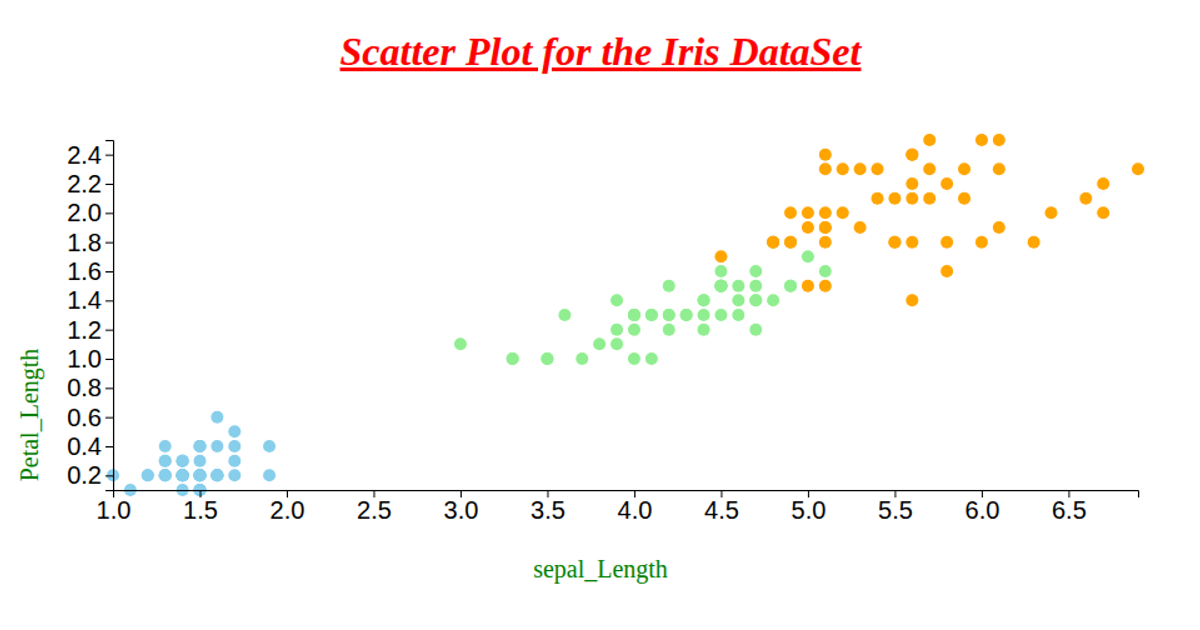
This scatter plot visualizes the Iris dataset, mapping petal length and width as point positions while encoding sepal dimensions through the circles' `rx` and `ry` attributes, despite using a standard circle element. Species are distinguished by color: skyblue for setosa, lightgreen for versicolor, and orange for virginica. The visualization is rendered as an SVG using D3 v6, with `d3.csv`, `scaleLinear`, `extent`, `axisLeft`, and `axisBottom` for data loading, scaling, and axes. Axis labels are added as SVG text elements.
AI-generated descriptionMIT Licensed




Comments
Sign in to join the discussion.