🌍 Public
Fork of Rendering Data with React & D3
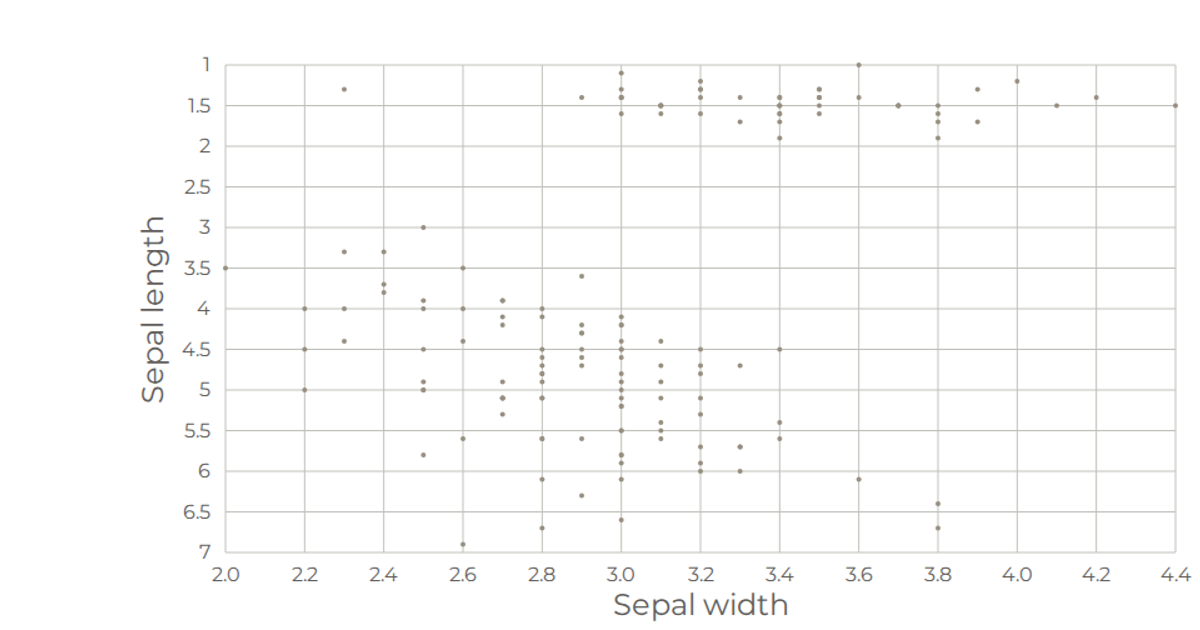
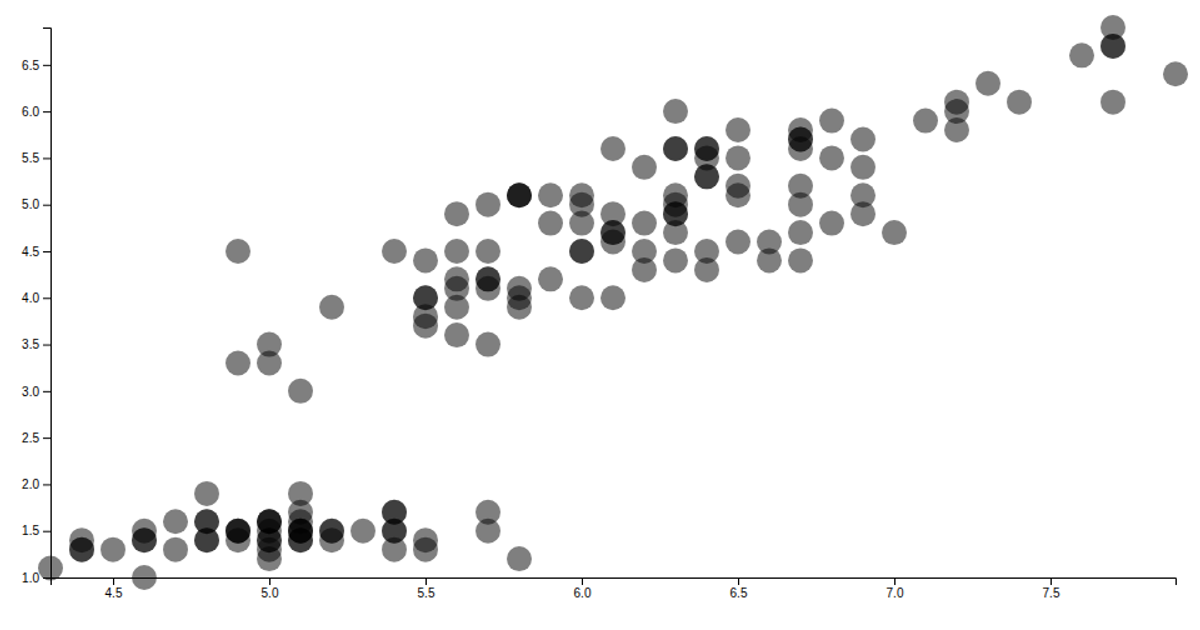
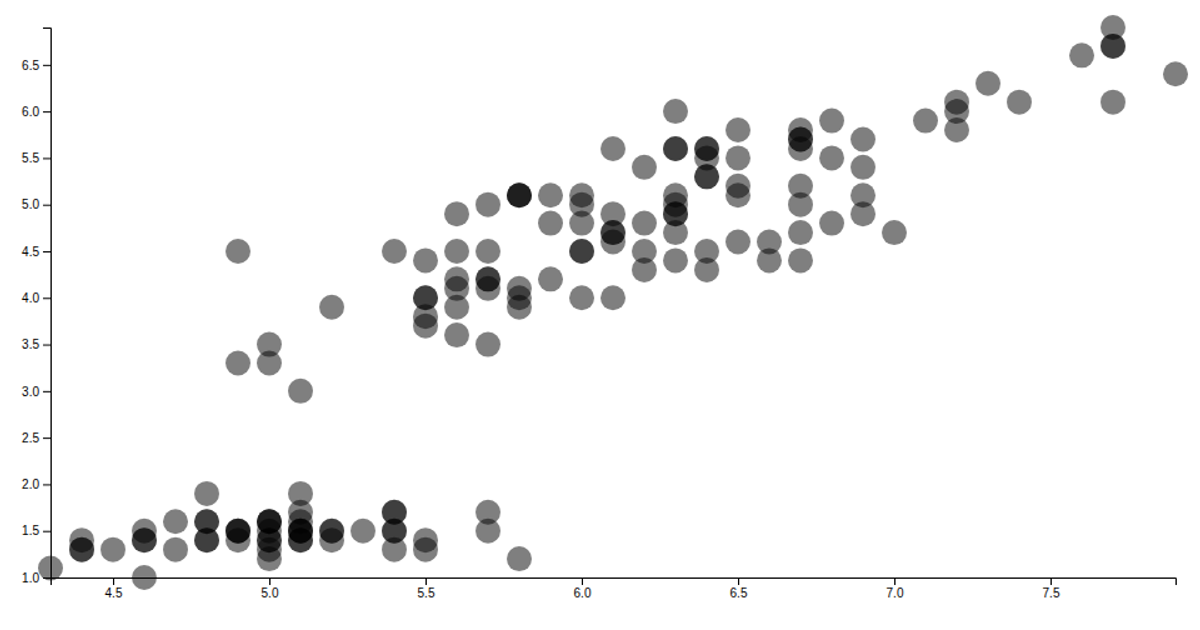
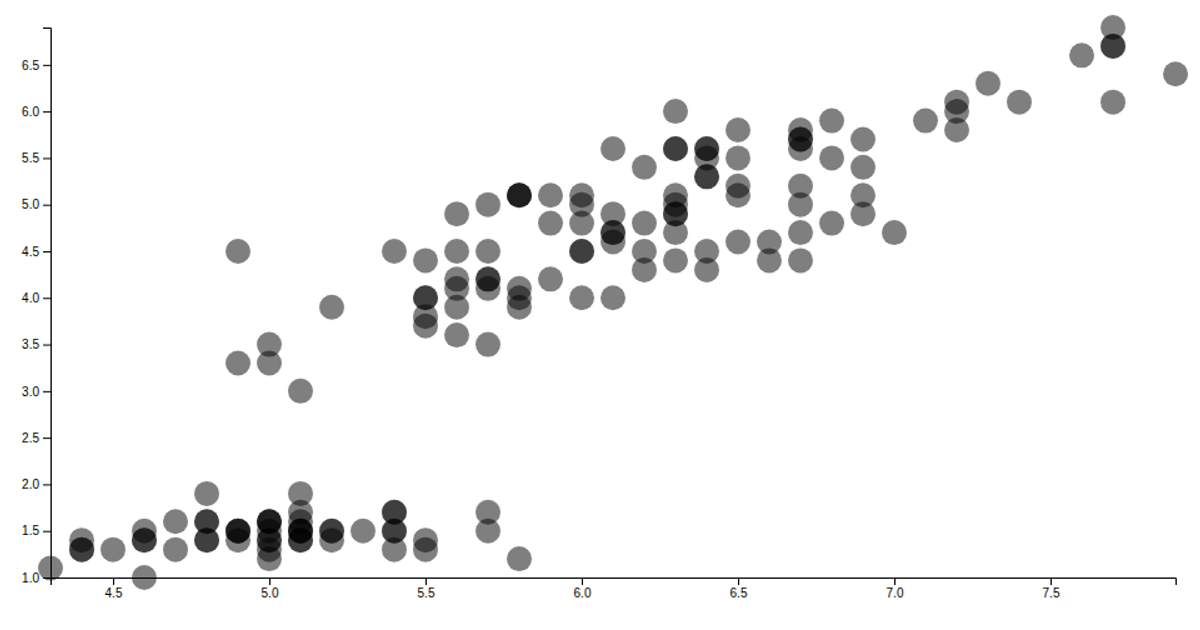
This visualization shows a scatter plot of iris flower measurements, plotting sepal length against sepal width. The code currently renders an empty SVG because the scales are commented out and no marks are drawn. It uses React for component rendering, D3’s `scaleLinear` and `extent` for scaling, and loads the iris dataset via D3’s `csv` utility in a custom `useData` hook. The page also contains unused bar chart and pie chart components, with the pie chart using `d3.arc` and `d3.pie` to render CSS named colors.
AI-generated descriptionA program that loads in some data about CSS named colors using D3 utilities, and uses React to render the data as a radial burst!
MIT Licensed




Comments
Sign in to join the discussion.