🌍 Public
Fork of Rendering Data with React & D3
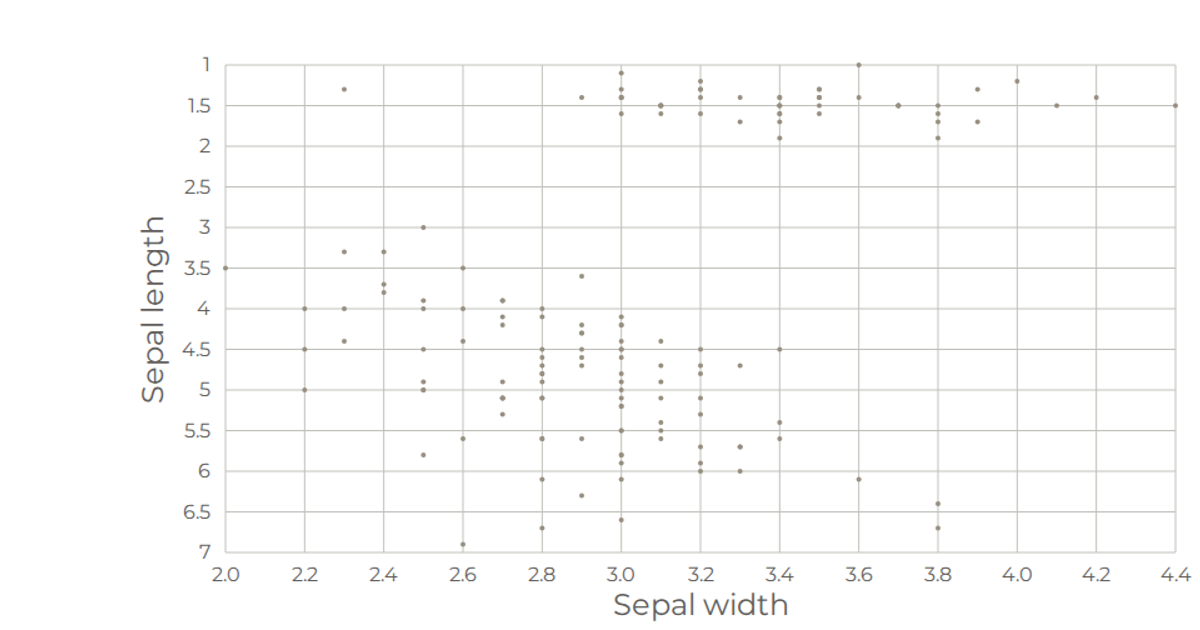
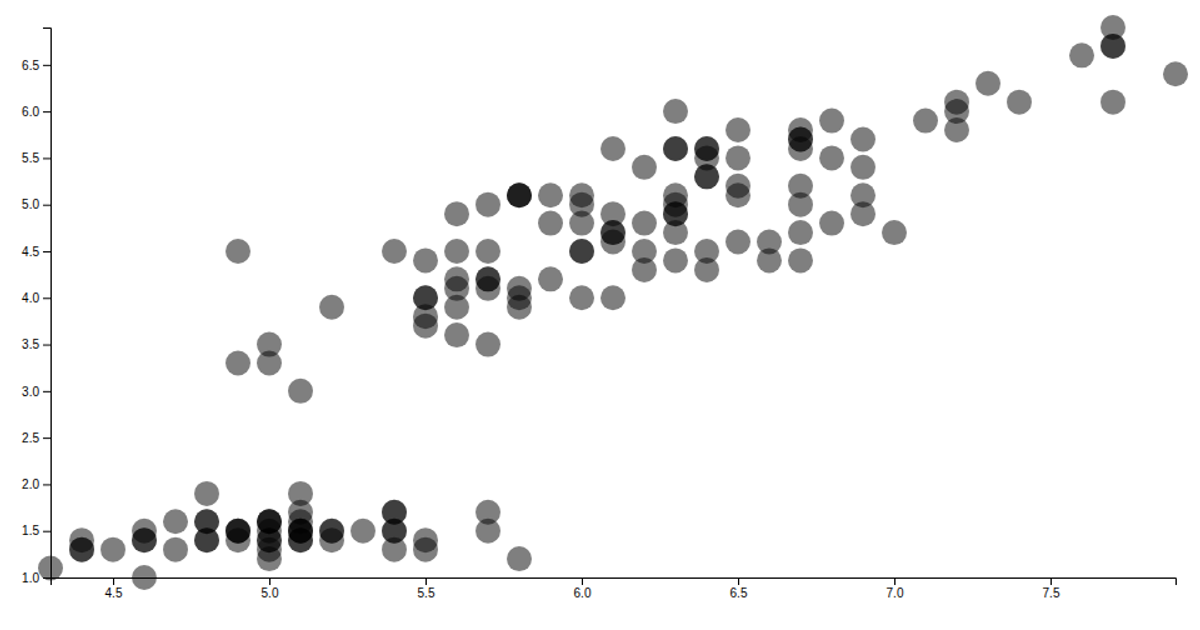
This visualization displays the Iris flower dataset as a scatter plot, mapping sepal length on the x-axis and sepal width on the y-axis. Built with React and D3 v5, the code uses `csv` from D3 to load the data and `scaleLinear` to create the axes. SVG circles represent each data point, with hover tooltips showing formatted values. The `AxisBottom` and `AxisLeft` components render gridlines and labels using React components that generate SVG elements.
AI-generated descriptionA program that loads in some data about CSS named colors using D3 utilities, and uses React to render the data as a radial burst!
MIT Licensed




Comments
Sign in to join the discussion.