🌍 Public
Fork of NCAA Women's Volleyball Visualization
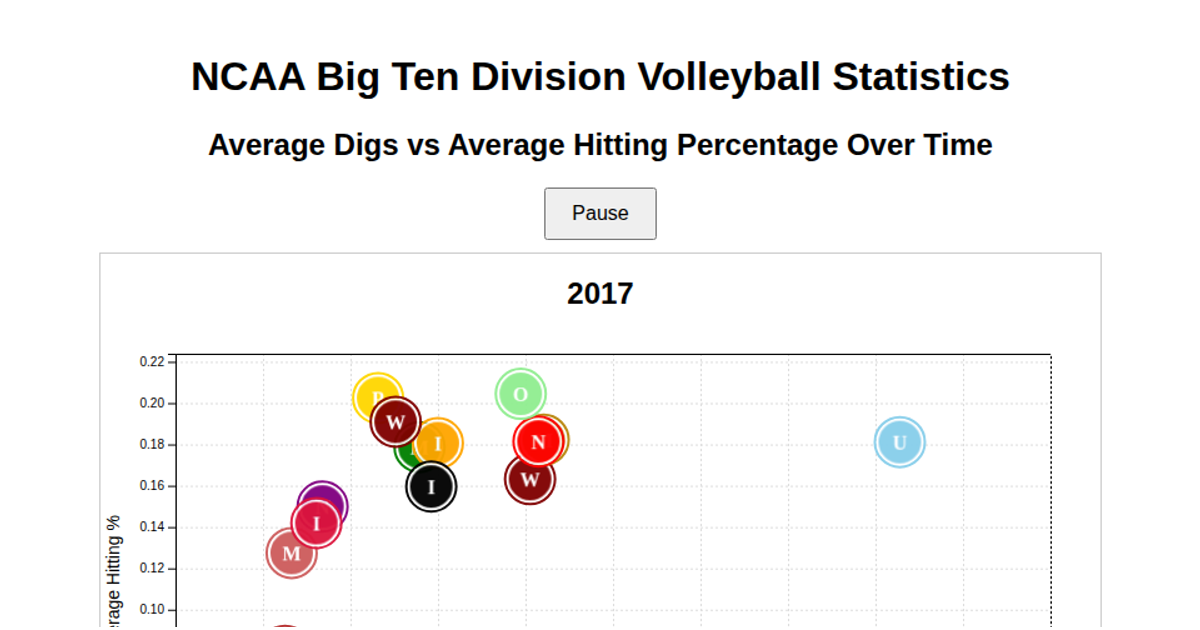
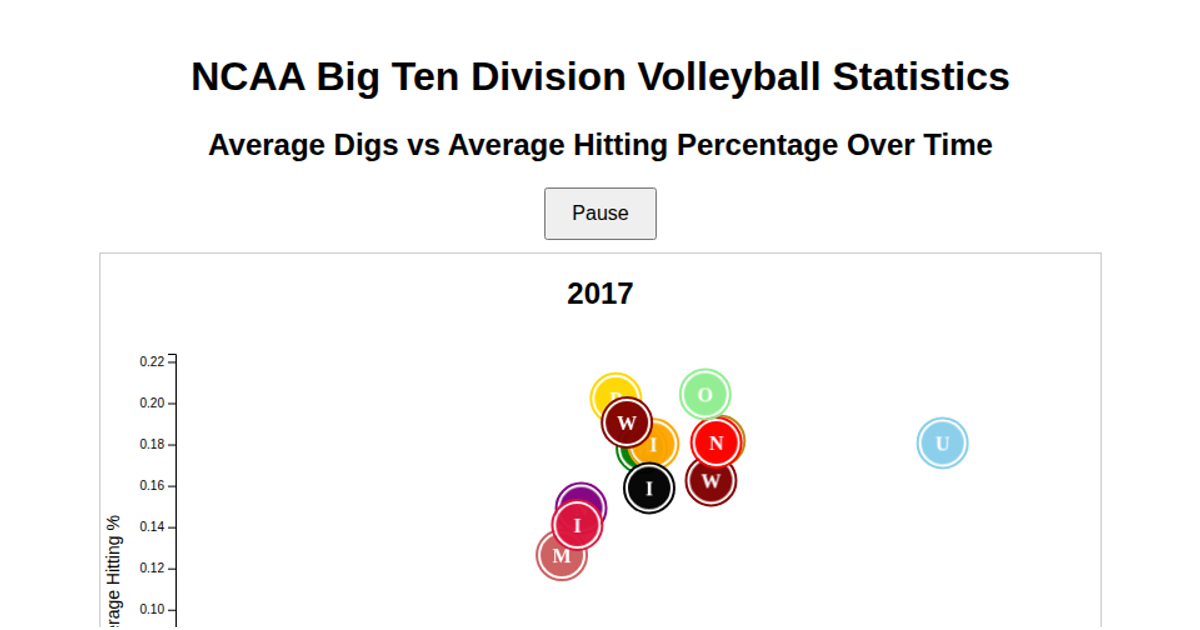
A scatterplot compares NCAA Big Ten women's volleyball teams by average digs against average hitting percentage. Each team appears as a circular point filled with its logo, with team colors applied as strokes. The visualization uses D3.js v7 to load CSV data, aggregate statistics, and render SVG points with axes and interactive tooltips. On hover, a tooltip displays the team's exact averages and the circle's stroke highlights in black.
AI-generated descriptionMIT Licensed




Comments
Sign in to join the discussion.