🌍 Public
NCAA Women's Volleyball Visualization
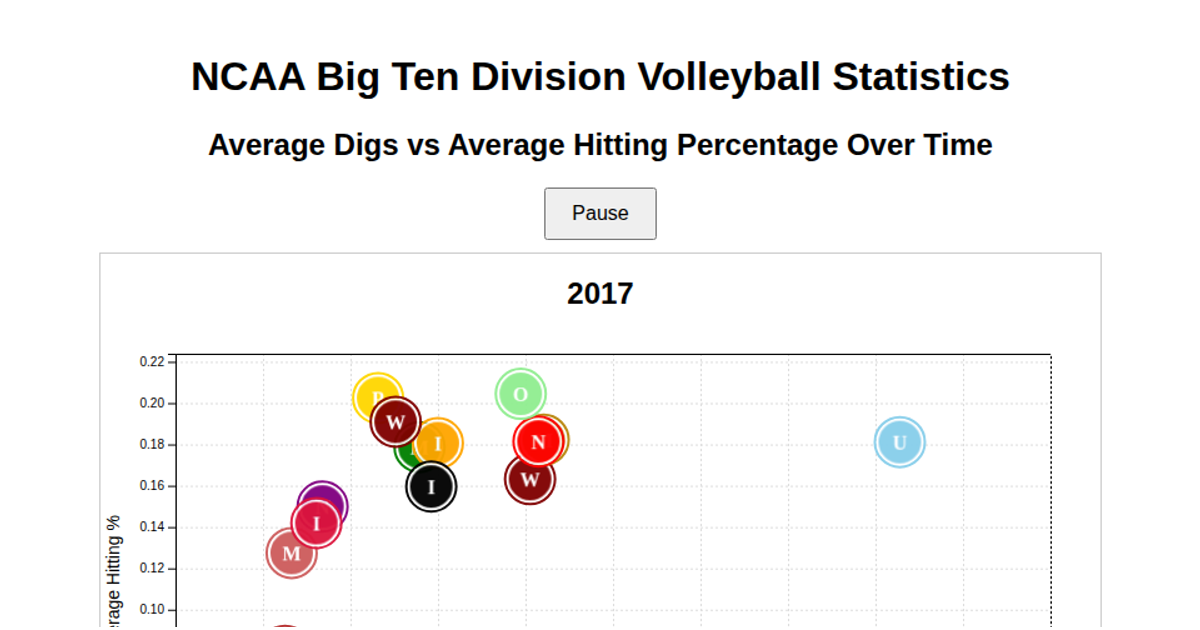
This visualization charts the relationship between average digs and average hitting percentage for NCAA Big Ten women’s volleyball teams over time. It uses an SVG scatterplot where each team appears as a circle filled with its logo, and the chart animates through yearly data. The code parses a CSV file with D3’s `d3.csv` and uses `d3.rollups` to compute team-year averages, while custom SVG patterns and inline base64-encoded logo fallbacks render each team’s icon. Team colors and logos are defined in JavaScript maps, and the visualization updates scales and positions as the year progresses.
AI-generated descriptionMIT Licensed


Comments
Sign in to join the discussion.