🌍 Public
Fork of Fork of Choropleth Map Zia1
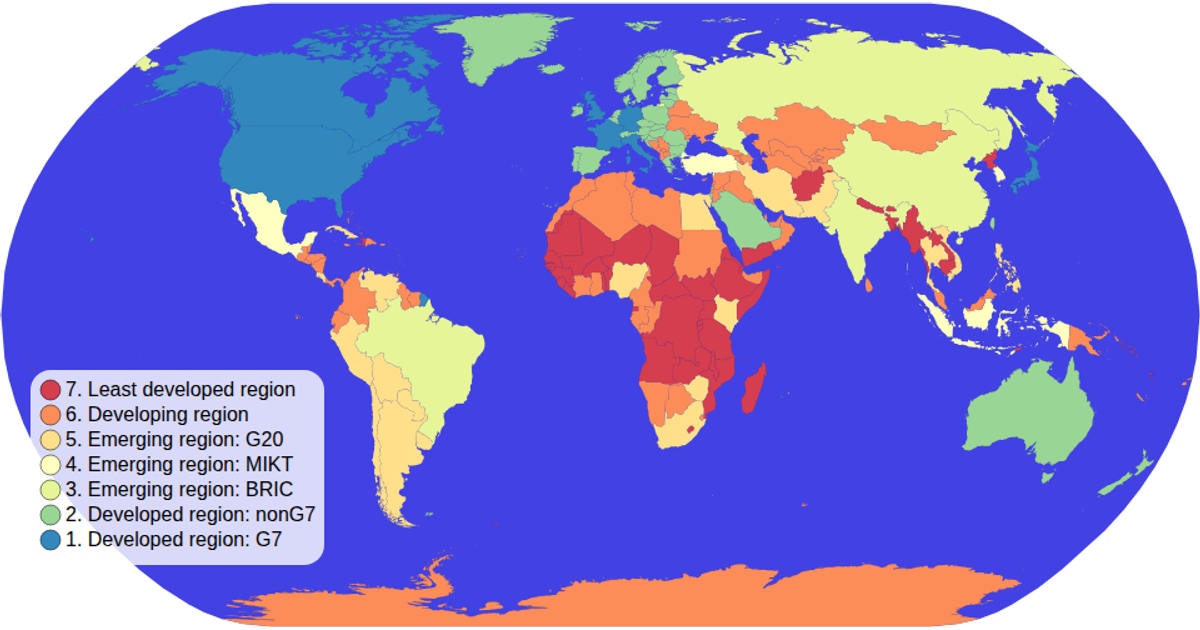
A choropleth map colors countries by economic classification using a categorical ordinal scale with the spectral color scheme, and includes a custom color legend with labeled circles. Users can pan and zoom the map via d3.zoom, while hovering highlights a country in red and displays its name and economic group in a tooltip. The visualization loads world geometry from TopoJSON and joins it with TSV metadata, projecting paths with d3.geoPath and d3.geoNaturalEarth1. Rendering is done in SVG within a D3 v5 framework, with a reusable colorLegend component.
AI-generated descriptionMIT Licensed



Comments
Sign in to join the discussion.