🌍 Public
Fork of Choropleth Map
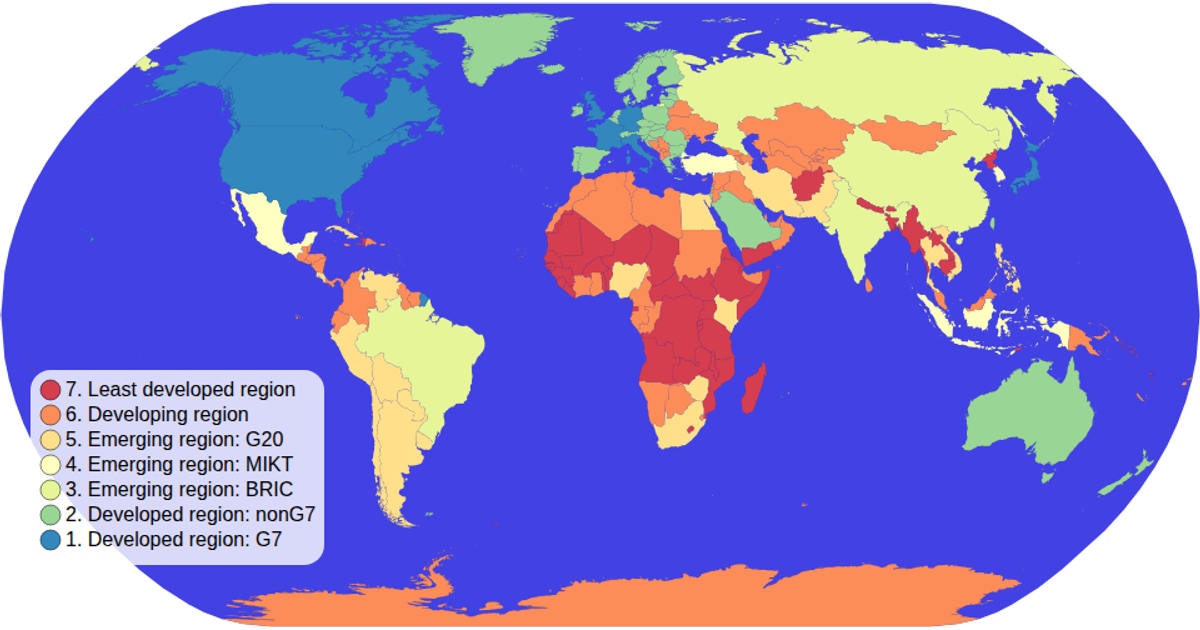
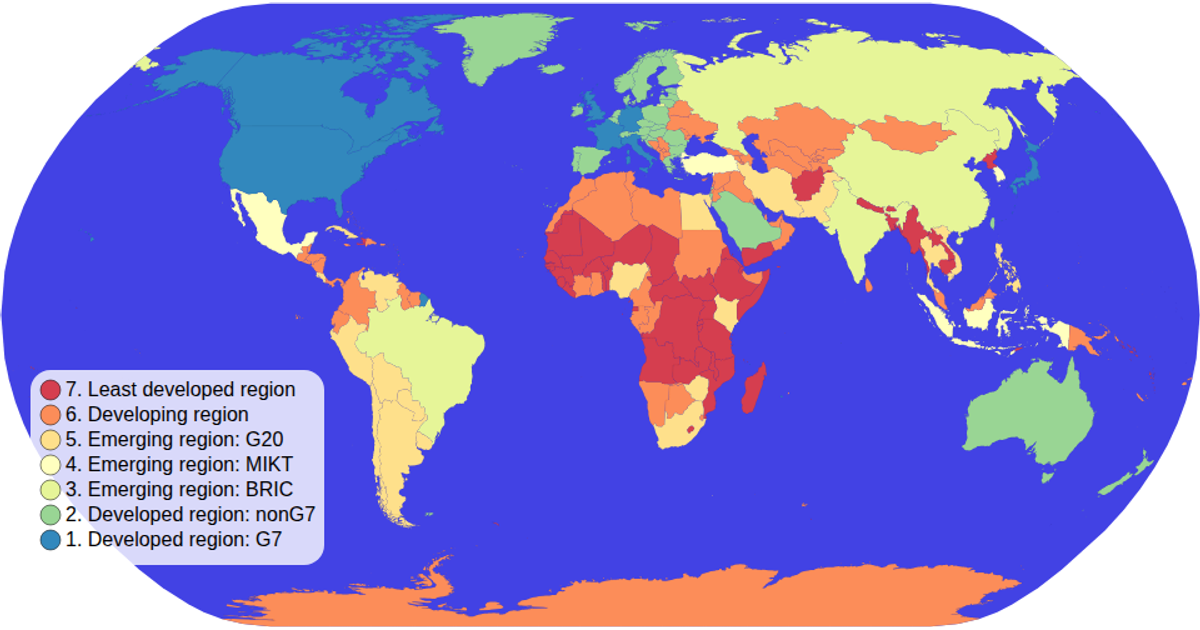
This choropleth map colors countries by economic grouping using an ordinal color scale with a spectral scheme. It visualizes world geography with a natural Earth projection and includes a custom SVG color legend with circles and labels. The map supports zooming and panning via d3.zoom, and country paths are generated with d3.geoPath from TopoJSON data loaded from the World Atlas. Hovering highlights countries in red, with tooltips prepared via the title element.
AI-generated descriptionMIT Licensed





Comments
Sign in to join the discussion.