🌍 Public
Circles on a Map of Slovakia
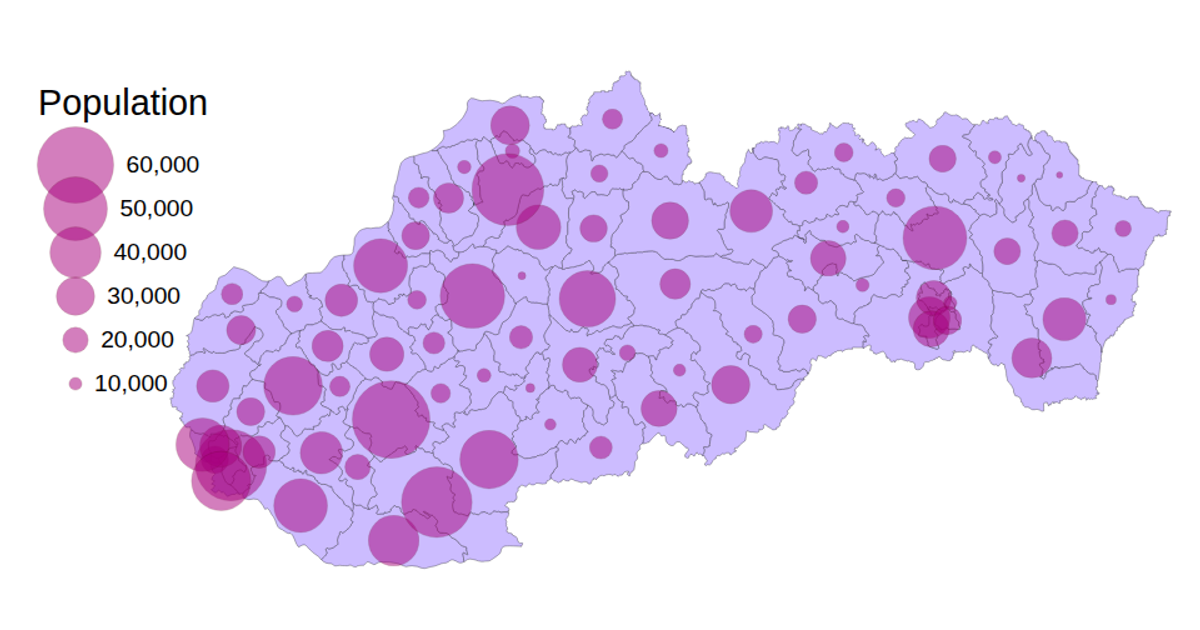
A choropleth map of Slovakia displays districts colored by municipal boundaries, overlaid with scaled circles indicating the number of apartments in residential buildings per district. The visualization uses D3 v5 with a Mercator projection and `geoPath` to render the TopoJSON geometry, while circle radii are sized via a linear `scaleLinear`. District data from a TSV file is joined with geometric features, and a `sizeLegend` displays the population scale. Pan and zoom interactions are enabled through a D3 zoom behavior.
AI-generated descriptionAn example showing the capabilities of VizHub.
MIT Licensed



Comments
Sign in to join the discussion.