🌍 Public
olympics
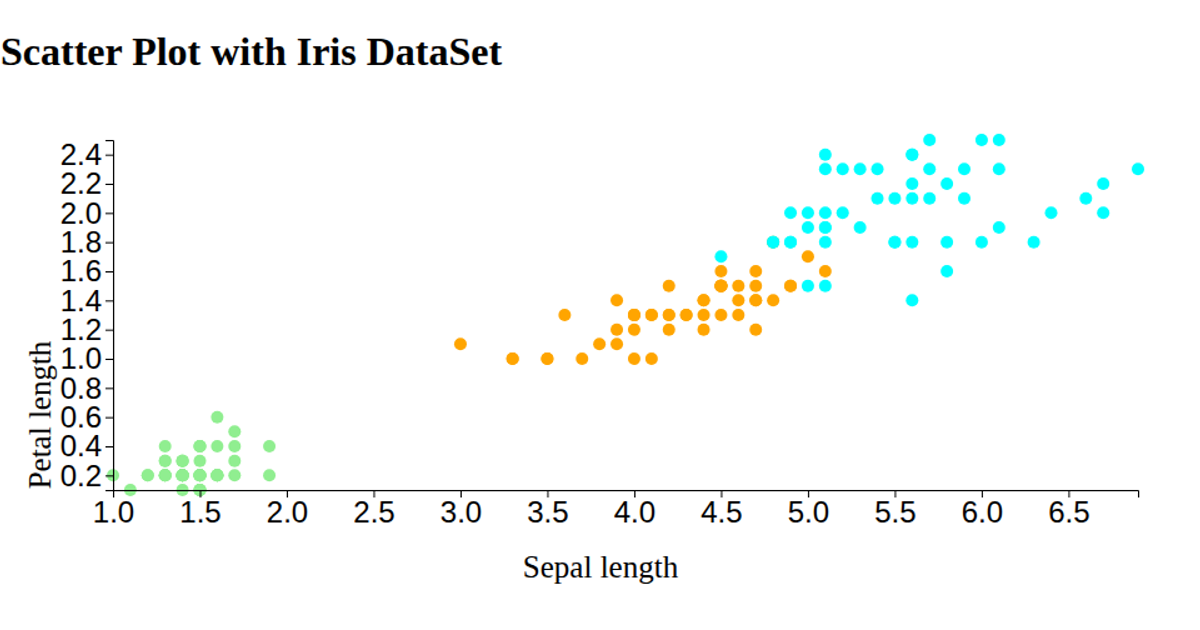
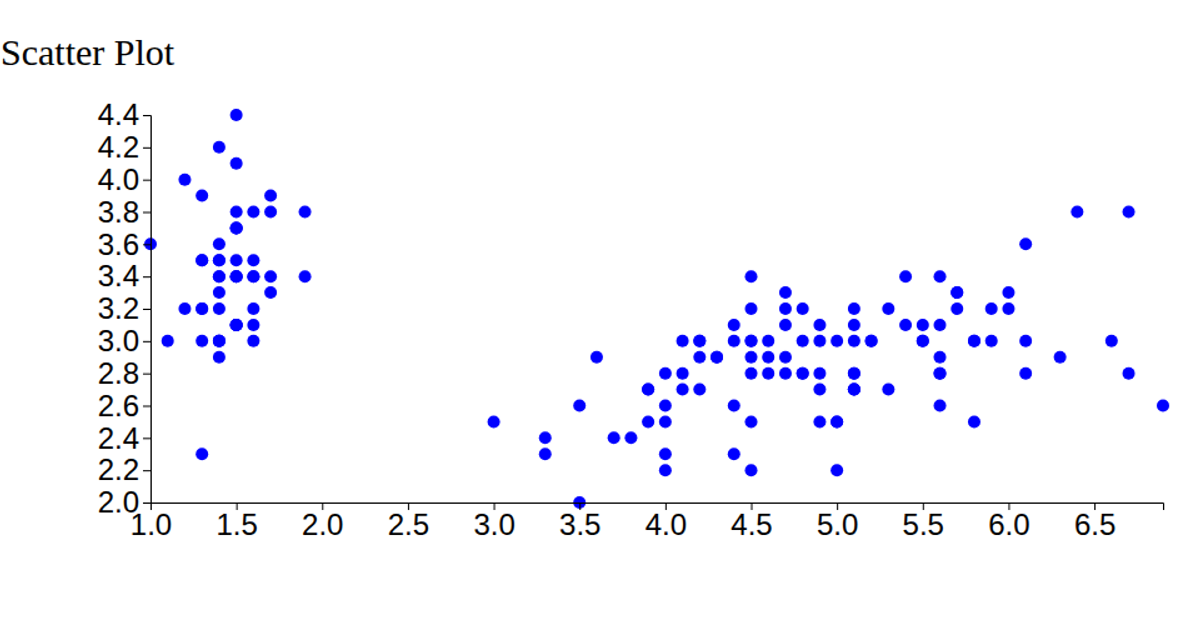
This scatterplot of the Iris dataset maps petal length against petal width, with each point colored by species. The chart uses a white-on-dark theme, with axes labeled “petal-length” and “petal-width,” and includes an interactive legend. Hovering over a species in the legend dims the other categories, highlighting the selected group.
AI-generated descriptionMIT Licensed




Comments
Sign in to join the discussion.